A Team Total Under Is Only 59 Percent Starting Pitcher
A team total under is sold as the cleanest pitcher bet in baseball. One lineup, one number, and the guy on the mound is the whole reason you are there. Tonight's board has three of them priced around a starter, so it is worth asking how much of a team total the starter actually controls.
The answer over 3,562 starts this season is 58.97 percent. The starting pitcher allows a little under six of every ten runs that land on the opponent's team total. The bullpen allows the other four, and the bullpen is not on the ticket in anyone's head when they bet the under.
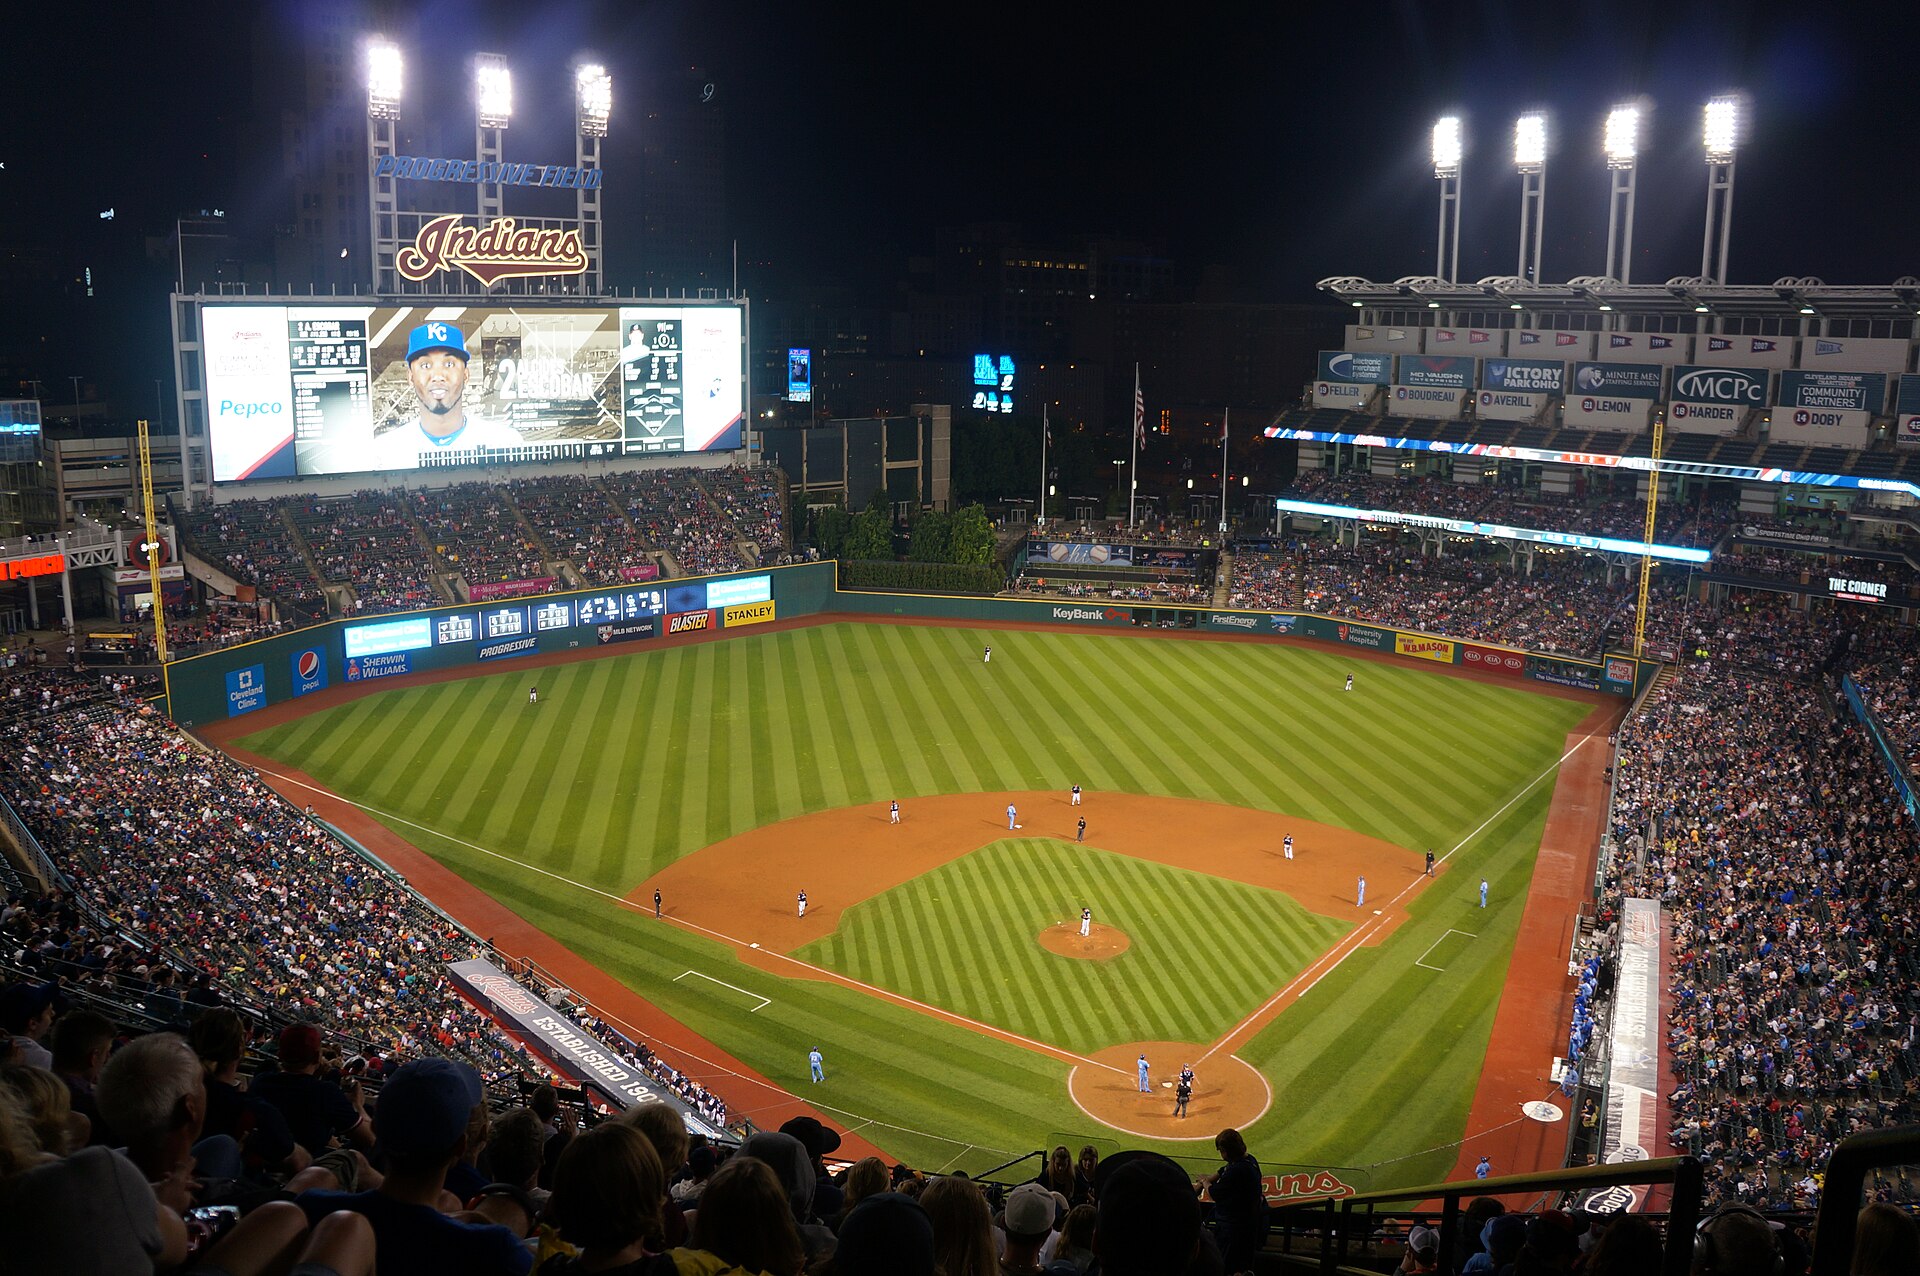
Progressive Field, Cleveland. Dylan Cease brings a 1.05 WHIP into a game where the Guardians team total is posted at 3.5. The study below says what that WHIP is worth and what it is not. Photo: Jfvoll, CC BY-SA 4.0, via Wikimedia Commons.
Before any pitcher is named, here is how often a team scores three or fewer, and four or fewer, in a 2026 game. This is every team game of the regular season through September 1, 4,166 of them, home and away counted separately.
| Team runs in a game | Team games | Share |
|---|---|---|
| 0 | 264 | 6.34% |
| 1 | 465 | 11.16% |
| 2 | 581 | 13.95% |
| 3 | 567 | 13.61% |
| 4 | 500 | 12.00% |
| 5 | 440 | 10.56% |
| 6 | 388 | 9.31% |
| 7 or more | 961 | 23.07% |
Three or fewer: 45.06 percent. Four or fewer: 57.06 percent. Home lineups score slightly more, 4.52 a game against 4.44 on the road, and their under 3.5 rate is 43.54 percent against 46.57. So a team total under 3.5 at a typical minus 120 to minus 140 price, which needs 54.5 to 58.3 percent, is starting from ten points behind the league baseline. Every one of those points has to come from the pitcher.
Take every pitcher with ten or more starts this season, 174 of them, and every game they started, 3,562 in all. Sort those starts by the pitcher's season WHIP. Then look not at what the starter allowed, but at what the opponent scored in the whole game, which is the number a team total is graded on.
| Starter season WHIP | Starts | Opponent scored 3 or fewer | 4 or fewer | Opponent runs, full game | Runs charged to the starter |
|---|---|---|---|---|---|
| Under 1.00 | 174 | 67.82% | 79.31% | 3.15 | 1.80 |
| 1.00 to 1.14 | 787 | 52.99% | 65.18% | 3.80 | 2.23 |
| 1.15 to 1.29 | 977 | 47.08% | 60.49% | 4.30 | 2.46 |
| 1.30 to 1.44 | 1,094 | 41.13% | 54.11% | 4.64 | 2.79 |
| 1.45 and up | 530 | 35.09% | 44.34% | 5.42 | 3.26 |
| All starts | 3,562 | 45.79% | 58.09% | 4.41 | 2.60 |
The slope is steep and it is monotonic. Behind a starter with a WHIP under 1.00, the opponent scores three or fewer two times in three. Behind a starter at 1.45 or worse, one time in three. That is the entire spread between an under 3.5 being a strong favourite and being a clear underdog, and it comes from one column on a pitching line.
Now read the last two columns together. In the elite bucket the starter is charged 1.80 runs and the opponent finishes with 3.15. The other 1.35 runs, 43 percent of the total, arrive after he leaves. In the worst bucket the starter allows 3.26 of 5.42, and the bullpen share is 40 percent. The share barely moves. A great starter lowers the number, he does not take the bullpen off the ticket.
Three team total unders are on the public card tonight, each priced around one starter. Here is what the season says about each of them, using the same full game measure.
| Starter | WHIP | Starts | Opponent 3 or fewer | Opponent 4 or fewer | Starter share of runs allowed | Posted under |
|---|---|---|---|---|---|---|
| Jacob Misiorowski, Brewers | 0.75 | 25 | 21 of 25 | 21 of 25 | 56.9% | Cubs under 3.5 |
| Dylan Cease, Blue Jays | 1.05 | 25 | 16 of 25 | 19 of 25 | 59.5% | Guardians under 3.5 |
| Bryce Miller, Mariners | 1.09 | 16 | 5 of 16 | 6 of 16 | 41.7% | Red Sox under 4.5 |
Misiorowski is the extreme case in the whole sample. Opponents have finished with three or fewer runs in 84 percent of his starts, against 67.82 for the elite bucket he sits in and 45.06 for the league. There is no bullpen story there either, because the Brewers pen has a lower ERA than any other. The Cubs are the counterweight: 5.37 runs a game, the highest in baseball, and three or fewer in only 35.97 percent of their games.
Cease is the bucket average almost exactly. Sixteen of 25 is 64 percent, the 1.00 to 1.14 bucket is 65.18 on the under 4.5 measure and 52.99 on the under 3.5. He is a good under 3.5 pitcher, not a freak.
Miller is the warning. A 1.09 WHIP puts him in the same bucket as Cease and the opponent has finished with four or fewer in only 6 of his 16 starts, 37.5 percent against a bucket rate of 65.18. His share of the runs allowed is 41.7 percent, well below the league's 58.97, which means the damage in his games is landing on the Seattle bullpen after he leaves. A WHIP tells you about the starter's innings. A team total is graded on all nine.
Three things follow from the table, and none of them is that unders are good.
First, the starter's WHIP is a real input and it is a large one. The gap from the best bucket to the worst is 33 points on the under 3.5 rate, which is bigger than the gap between any two prices a book will post on the same number.
Second, 41 percent of the runs on a team total are not the starter's, and the share does not shrink when the starter is elite. The right question for a team total under is not only who starts, it is who follows him and how early. A starter who leaves after five with a 1.00 WHIP hands four innings to a bullpen that is graded on your ticket.
Third, the lineup is still in the equation. The Cubs and the Guardians are both posted at 3.5 tonight behind similar starter profiles, and the Cubs have scored three or fewer in 36 percent of their games against 45 for Cleveland. Same number, same kind of pitcher, nine points of base rate apart before the mound matters.
How This Was Built
- Team game sample
- Every 2026 regular season game in the MLB Stats API schedule with a Final status from March 25 through September 1, 2026, 2,083 games, each counted once for the home lineup and once for the away lineup, 4,166 team games. Extra inning runs included at face value.
- Starter sample
- Every pitcher with ten or more games started in the 2026 regular season per the Stats API season pitching leaders, 174 pitchers. Each pitcher's game log was pulled and every game with gamesStarted equal to one was kept, 3,562 starts. Openers and bulk relievers with fewer than ten starts are excluded.
- Opponent runs, full game
- The final score of the pitcher's opponent in that game, joined on gamePk to the schedule sample. This is the number a team total is graded on.
- Runs charged to the starter
- The runs column on the pitcher's own game log line for that start, earned and unearned.
- Starter share
- Total runs charged to starters in the bucket divided by total opponent runs in the same games.
- WHIP buckets
- The pitcher's season WHIP as of September 2, applied to all of his starts. That is a full season figure applied backwards, so early season starts are bucketed by a number the pitcher had not yet earned.
What is not checked, and cannot be:
- No prices anywhere. A 67.82 percent hit rate is worth a different amount at minus 120 than at minus 140 and none of that is measured.
- Season WHIP is applied to every start including the ones before it was known. A pitcher at 0.95 in September was not 0.95 in April, and the bucket rates are flattered by hindsight.
- Lineup quality is not controlled. Elite starters do not face a random sample of lineups, and the schedule decides part of the table.
- Park, weather and umpire are ignored.
- The 174 start elite bucket is small. A binomial standard error at 68 percent on 174 observations is 3.5 points.
- Bullpen share is measured, not attributed. Whether a starter leaving early is the cause of the bullpen runs or a symptom of the same bad night is not separable here.
- Nothing here says which side of a team total to take.
Related reading
The first five innings score at the same rate as the whole game
Baseball totals land on odd numbers 57.87 percent of the time
Five unders on one night is not one bet
Betting glossary: pushes, implied probability and how American odds convert
Related reading
A -1 Run Line Pushes 15 Percent Of The Time, And Almost Nothing Clears What It
Yankee Stadium in the Bronx. A -1 run line gives the money back when the favorite wins by exactly one, which happened in 338 of …
The Push Is The Product: 27.27 Percent Of 2026 MLB Games Are One Run Games
Everybody knows the run line as -1.5. Lay a run and a half, get plus money, lose the ticket when your team wins 4 to 3. It is th…
Baseball Totals Land On Odd Numbers 57.87 Percent Of The Time
Every totals market gives you a choice you rarely think about. You can take 7.5 or you can take 8. The half run costs about fift…
Why lines move
What moves a number after it opens, who moves it, and which explanations do not survive contact with the data.
Bet types and situational edges
What each bet type actually costs, and which situational angles hold up.
Related reading
A -1 Run Line Pushes 15 Percent Of The Time, And Almost Nothing Clears What It
Yankee Stadium in the Bronx. A -1 run line gives the money back when the favorite wins by exactly one, which happened in 338 of …
The Push Is The Product: 27.27 Percent Of 2026 MLB Games Are One Run Games
Everybody knows the run line as -1.5. Lay a run and a half, get plus money, lose the ticket when your team wins 4 to 3. It is th…
Baseball Totals Land On Odd Numbers 57.87 Percent Of The Time
Every totals market gives you a choice you rarely think about. You can take 7.5 or you can take 8. The half run costs about fift…
Why lines move
What moves a number after it opens, who moves it, and which explanations do not survive contact with the data.
Bet types and situational edges
What each bet type actually costs, and which situational angles hold up.