The Push Is The Product: 27.27 Percent Of 2026 MLB Games Are One Run Games
Everybody knows the run line as -1.5. Lay a run and a half, get plus money, lose the ticket when your team wins 4 to 3. It is the standard baseball spread and it is the reason so many people who pick the right side still lose.
There is a second version of that bet, offered as -1, and almost nobody talks about what it actually costs and what it actually buys. So I pulled every completed 2026 regular season game, 2,138 of them, and measured the thing the whole number line is built around.
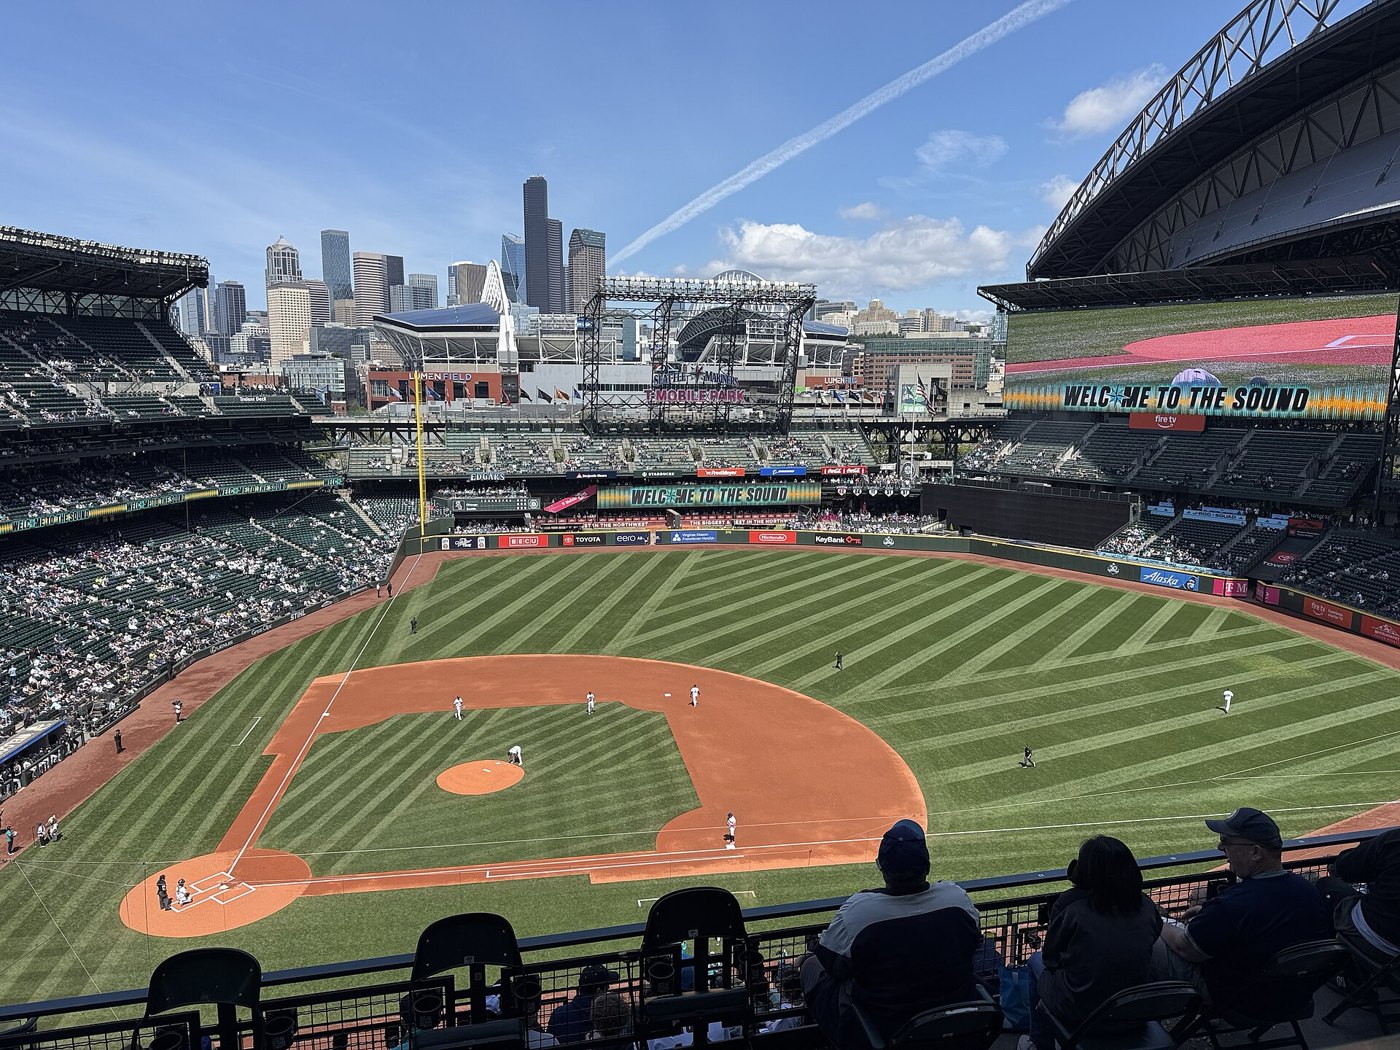
T-Mobile Park, Seattle. The whole number run line is the only baseball bet where the one run game stops being a loss and becomes a refund. Photo: Seth Tisue, CC BY-SA 4.0, via Wikimedia Commons.
Not a common result. The most common result, by a wide margin, and it is not close.
| Final margin | Games | Share | Running total |
|---|---|---|---|
| 1 run | 583 | 27.27% | 27.27% |
| 2 runs | 404 | 18.90% | 46.16% |
| 3 runs | 310 | 14.50% | 60.66% |
| 4 runs | 216 | 10.10% | 70.77% |
| 5 runs | 188 | 8.79% | 79.56% |
| 6 runs | 146 | 6.83% | 86.39% |
| 7 or more | 291 | 13.61% | 100% |
More than one in four games in 2026 has landed on the exact number that separates a -1 ticket from a -1.5 ticket. On -1.5 those 583 games were losses. On -1 they were refunds. That is the entire product, and it is worth pricing properly.
Season win percentage is a rough proxy for how often a club is favoured, so split all 4,276 team games by the club's own record and look at the three outcomes that matter: win by two or more, win by exactly one, lose.
| Team record | Team games | Win by 2+ | Win by exactly 1 | Lose |
|---|---|---|---|---|
| .550 and better | 996 | 42.77% | 15.76% | 41.47% |
| .500 to .549 | 1,141 | 37.25% | 14.37% | 48.38% |
| .450 to .499 | 1,425 | 34.88% | 12.63% | 52.49% |
| Under .450 | 714 | 28.99% | 11.48% | 59.52% |
Now convert that into the only number a bettor cares about, the rate at which each ticket cashes once pushes are taken out of the denominator.
| Team record | Moneyline | Run line -1.5 | Whole run line -1 |
|---|---|---|---|
| .550 and better | 58.53% | 42.77% | 50.77% |
| .500 to .549 | 51.62% | 37.25% | 43.50% |
| .450 to .499 | 47.51% | 34.88% | 39.92% |
| Under .450 | 40.48% | 28.99% | 32.75% |
For a genuine contender, laying -1 has cashed 50.77 percent of decided tickets this season against 42.77 percent for -1.5. That is eight full percentage points, and it comes entirely from the 583 one run games moving out of the loss column.
Split the good teams by venue and the push rate is not stable. It is a home effect, and it is a large one.
| .550 or better team | Team games | Win by 2+ | Push on -1 | Lose |
|---|---|---|---|---|
| At home | 498 | 41.57% | 19.08% | 39.36% |
| On the road | 498 | 43.98% | 12.45% | 43.57% |
Nearly one in five home games for a contender ends in a one run win. The reason is structural rather than mysterious. The home team stops batting the moment it takes the lead in the ninth, so a walkoff single that would have been a three run inning on the road gets recorded as a one run win. A good part of the extra push rate at home is games that simply ended early.
That flips the usual instinct. Most people lay the bigger number at home because the home side feels safer. The 2026 data says the home contender is the one whose margin gets clipped, and the whole number line is where you want to be when it happens.
Same idea at the club level. Of every win a team has recorded this season, what share came by exactly one run?
| Club | Wins | Share of wins by one run |
|---|---|---|
| Cincinnati Reds | 68 | 35.3% |
| Los Angeles Dodgers | 85 | 34.1% |
| Arizona Diamondbacks | 75 | 33.3% |
| Athletics | 57 | 33.3% |
| Pittsburgh Pirates | 70 | 32.9% |
| Seattle Mariners | 66 | 31.8% |
| the other end of the same list | ||
| Houston Astros | 73 | 17.8% |
| San Francisco Giants | 60 | 20.0% |
| Detroit Tigers | 64 | 20.3% |
| Minnesota Twins | 68 | 20.6% |
| New York Yankees | 81 | 21.0% |
The spread between the top and the bottom of that list is enormous. A Cincinnati win is twice as likely to be a one run win as a Houston win. If you are laying -1 with the Reds you are buying a lot of refund. If you are laying -1 with the Astros you are paying for a push that mostly does not arrive, and you would rather have the -1.5 and the plus money.
Seattle at home against Oakland is the clean live example. The Mariners win by exactly one run in 31.8 percent of their wins, they are a home side that stops hitting when it goes ahead in the ninth, and Oakland is the worst run prevention club on today's board at 5.71 allowed a game. The -1.5 is a ticket you lose on every walkoff. The -1 turns those into refunds.
The whole number line was quoted at -145 in one shop and -133 in another this morning, on the same game, at the same minute. That gap is bigger than the edge in most bets people spend all week hunting for. Price the push, then shop it.
Three rules fall out of the data and none of them require a model.
One. If you are on a contender, the whole number line is worth roughly eight points of win rate over -1.5, so it is worth paying up to about -103 before it stops being the better ticket.
Two. Home contenders push far more than road contenders, 19.08 percent against 12.45. Take -1 at home and take -1.5 on the road, not the other way round.
Three. Club identity matters more than the league average. Some rosters produce one run wins as a habit and some almost never do, and that is the difference between a refund you paid for and a refund you never see.
Related reading
A -1 Run Line Pushes 15 Percent Of The Time, And Almost Nothing Clears What It
Yankee Stadium in the Bronx. A -1 run line gives the money back when the favorite wins by exactly one, which happened in 338 of …
Baseball Totals Land On Odd Numbers 57.87 Percent Of The Time
Every totals market gives you a choice you rarely think about. You can take 7.5 or you can take 8. The half run costs about fift…
A Team Total Under 4.5 Hits 58 Percent Of The Time, Until You Check Who Is Pit
American Family Field in Milwaukee, home of the 1.97 ERA that put this question on the board. Photo: DiscoA340, CC BY-SA 4.0, vi…
Why lines move
What moves a number after it opens, who moves it, and which explanations do not survive contact with the data.
Bet types and situational edges
What each bet type actually costs, and which situational angles hold up.
Related reading
A -1 Run Line Pushes 15 Percent Of The Time, And Almost Nothing Clears What It
Yankee Stadium in the Bronx. A -1 run line gives the money back when the favorite wins by exactly one, which happened in 338 of …
Baseball Totals Land On Odd Numbers 57.87 Percent Of The Time
Every totals market gives you a choice you rarely think about. You can take 7.5 or you can take 8. The half run costs about fift…
A Team Total Under 4.5 Hits 58 Percent Of The Time, Until You Check Who Is Pit
American Family Field in Milwaukee, home of the 1.97 ERA that put this question on the board. Photo: DiscoA340, CC BY-SA 4.0, vi…
Why lines move
What moves a number after it opens, who moves it, and which explanations do not survive contact with the data.
Bet types and situational edges
What each bet type actually costs, and which situational angles hold up.