When Form And Record Disagree It Is A Coin Flip
A club is 9-1 in its last ten and averaging better than five runs a night. Across the field is a team eleven games better in the standings that has been quietly excellent since April. Everybody at the table has an opinion about which one to back, and almost everybody states it as though the answer is obvious. It is checkable, and the answer is that it is not obvious to anyone, including the two clubs.
The test is narrow on purpose. Take every 2026 regular season game where both teams had already played at least 40 games, so that both a season sample and a recent form sample exist. Ask four different one line methods to name a winner using only information available before first pitch, then count how often each was right straight up. No prices, no closing lines, no market data. Just who won.
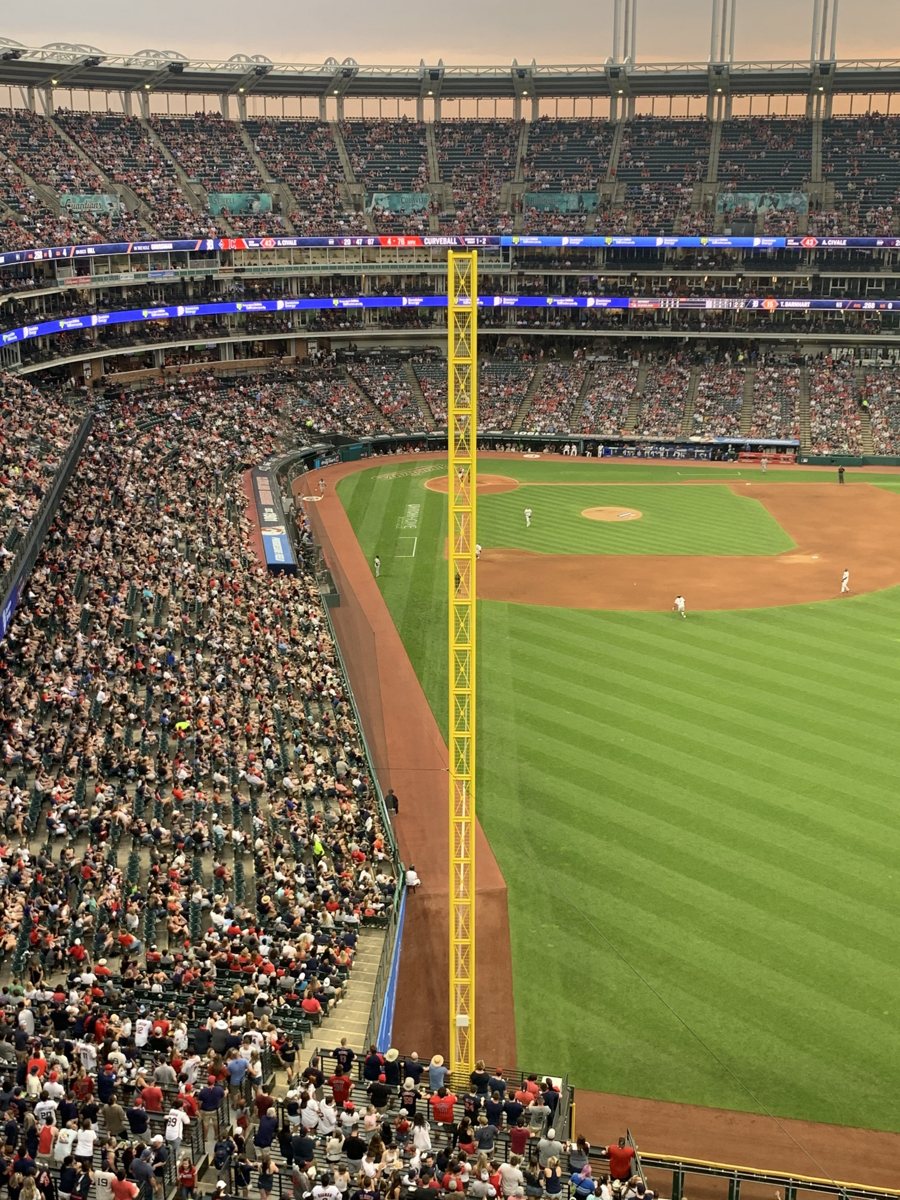
Progressive Field, where a club 8-2 in its last ten hosts a club 9-1 in its last ten this afternoon. Photo: Cards84664, Wikimedia Commons, CC BY-SA 4.0.
The sample is 1,418 games. Every one of them had both clubs at 40 or more completed games, and every input was computed from games that had already finished, so nothing here peeks at the future. The four methods are as simple as they sound.
| Method | Straight up winners | Hit rate |
|---|---|---|
| Better season run differential per game | 763 of 1,418 | 53.8% |
| Better run differential over the last 15 | 758 of 1,418 | 53.5% |
| Better win rate over the last 10 | 751 of 1,418 | 53.0% |
| Home team, always | 744 of 1,418 | 52.5% |
Every method beats a coin, which is not surprising, because in most games the better team and the hotter team are the same club and both methods point at it. The spread between the best method and simply backing the home side is 1.3 percentage points across 1,418 games. That is the entire predictive content of every form and record heuristic in this list, measured against the crudest possible baseline.
In 435 of the 1,418 games, the club with the better season run differential and the club with the better last 15 run differential were two different teams. That is the exact situation that produces the argument at the top of this article, and it happens in 31 percent of games between two established clubs.
| Side backed in the 435 disagreements | Record | Hit rate |
|---|---|---|
| The better season club | 220-215 | 50.6% |
| The hotter recent club | 215-220 | 49.4% |
Five games. That is the entire gap across a full season of disagreements. Backing the season long resume rather than the hot streak was right 220 times and wrong 215 times, and no honest reading of 435 trials calls a 2.5 game edge over the midpoint a finding. The standard error on a 50 percent rate at this sample size is 2.4 percentage points, so 50.6 percent and 49.4 percent are the same number wearing different jerseys.
This matters more than it looks, because the two methods are not equally expensive. Season run differential is public, stable and already inside the price. Recent form is the thing people talk themselves into paying extra for. The measurement says the extra is buying nothing.
The obvious follow up is whether a big divergence behaves differently from a small one. Splitting the 435 disagreements by how far apart the two clubs were in last 15 run differential gives this.
| Gap in last 15 run differential | Hot side record | Hit rate |
|---|---|---|
| Under 1 run a game | 128 of 258 | 49.6% |
| 1 to 2 runs a game | 54 of 119 | 45.4% |
| More than 2 runs a game | 33 of 58 | 56.9% |
Read that table with the sample sizes in front of you, not the percentages. Fifty eight games is nothing. A 56.9 percent rate on 58 trials is four extra wins over a coin, and four wins is well inside the noise of a sample that small. The same is true of the 45.4 percent in the middle row. The correct summary of this table is that there is no visible pattern, not that huge streaks are good and medium streaks are bad.
The narrowest version of the question gives the same answer. Take only the games where a club entered at 8-2 or better over its last ten and faced an opponent with the better season run differential. That happened 33 times this year. The hot club went 18-15.
One. A hot streak is not a reason to move a number. If your read on a game changes because a club won eight of ten, you are adding a variable that produced a 215-220 record this season in exactly the spot where it is supposed to matter most.
Two. A hot streak is also not a reason to fade. The symmetric error is treating recent form as a contrarian signal and buying the cold team. That side went 220-215. Both directions are the same coin.
Three. The real inputs live below this level. Who is starting, how deep he goes, what the bullpen has left, what the park does to run scoring. Those are game specific and none of them are captured by a ten game record. Form is a summary statistic of things that already happened to other pitchers.
Four. If a price moved because of a streak, that is the actual opportunity. This study measures straight up outcomes with no odds attached. A market that shades a number toward the hot club is selling the stale side of a coin flip, and that is a different and better question than the one answered here.
How This Was Built
- Sample
- Every completed 2026 regular season game from March 15 through August 28 in the MLB Stats API schedule endpoint, 2,025 games. A game entered the study only when both clubs had already completed 40 or more games this season, leaving 1,418 games.
- Inputs
- Every input was computed from that club's completed games strictly before the game being predicted. Season run differential per game is total runs scored minus total runs allowed divided by games played. Last 15 is the same quantity over the fifteen most recent completed games. Last 10 win rate is wins divided by ten.
- Outcome
- Straight up winner of the game. Ties are impossible in this dataset because no completed regular season game finished level.
- Disagreement
- A game counts as a disagreement when the club with the higher season run differential and the club with the higher last 15 run differential are different clubs. Exact ties on either measure resolve to the away club and are rare.
- Standard error
- Binomial, computed as the square root of p times one minus p divided by n at p equal to 0.5 and n equal to 435, which is 2.4 percentage points.
What is not checked, and cannot be:
- No prices. This is straight up win rate only. A method that picks winners 50.6 percent of the time can still be profitable or ruinous depending entirely on what it costs to buy that side, and none of that is measured here.
- One season, one league, 1,418 games. A second year could move the disagreement split by a couple of points in either direction without anything real having changed.
- Starting pitchers are ignored. A club whose last 15 happens to include five starts from its ace is treated identically to one that did not, and that is a real and unmeasured source of noise.
- Injuries, call ups, trade deadline roster changes and September expansion are invisible to this method. A club that is genuinely different from the one that played those 15 games is scored as though it is the same club.
- Last 15 and last 10 are arbitrary windows chosen because they are the ones people quote. A 7 game or 25 game window was not tested and could behave differently.
- Strength of schedule is not adjusted. A club that went 9-1 against the two worst teams in its division earns the same form score as one that did it on a road trip through contenders.
Related reading
Five unders on one night is not one bet
The bullpen tax on a team total under
Betting glossary: run differential, implied probability and how American odds convert
Related reading
A -1 Run Line Pushes 15 Percent Of The Time, And Almost Nothing Clears What It
Yankee Stadium in the Bronx. A -1 run line gives the money back when the favorite wins by exactly one, which happened in 338 of …
The Push Is The Product: 27.27 Percent Of 2026 MLB Games Are One Run Games
Everybody knows the run line as -1.5. Lay a run and a half, get plus money, lose the ticket when your team wins 4 to 3. It is th…
Baseball Totals Land On Odd Numbers 57.87 Percent Of The Time
Every totals market gives you a choice you rarely think about. You can take 7.5 or you can take 8. The half run costs about fift…
Why lines move
What moves a number after it opens, who moves it, and which explanations do not survive contact with the data.
Bet types and situational edges
What each bet type actually costs, and which situational angles hold up.
Related reading
A -1 Run Line Pushes 15 Percent Of The Time, And Almost Nothing Clears What It
Yankee Stadium in the Bronx. A -1 run line gives the money back when the favorite wins by exactly one, which happened in 338 of …
The Push Is The Product: 27.27 Percent Of 2026 MLB Games Are One Run Games
Everybody knows the run line as -1.5. Lay a run and a half, get plus money, lose the ticket when your team wins 4 to 3. It is th…
Baseball Totals Land On Odd Numbers 57.87 Percent Of The Time
Every totals market gives you a choice you rarely think about. You can take 7.5 or you can take 8. The half run costs about fift…
Why lines move
What moves a number after it opens, who moves it, and which explanations do not survive contact with the data.
Bet types and situational edges
What each bet type actually costs, and which situational angles hold up.