Two Aces Move The First Five Under From 50 Percent To 74
A first five innings total is sold as a pitching bet. Take the bullpens out, the pitch goes, and you are left with a clean read on the two men who actually start the baseball game. That is a nice story and it is worth asking how much of it the scoreboard supports, because the prices on the low first five numbers have moved a long way this season and somebody is paying them.
Here is the base rate. Every completed 2026 regular season game with at least five innings on the linescore, 2,108 of them, bucketed on the combined runs scored by both teams through five. The mean is 4.991 runs and the under 4.5 hits 50.05 percent of the time. Not 51, not 49. A coin flip to two decimal places, which is what a well set half number is supposed to look like.
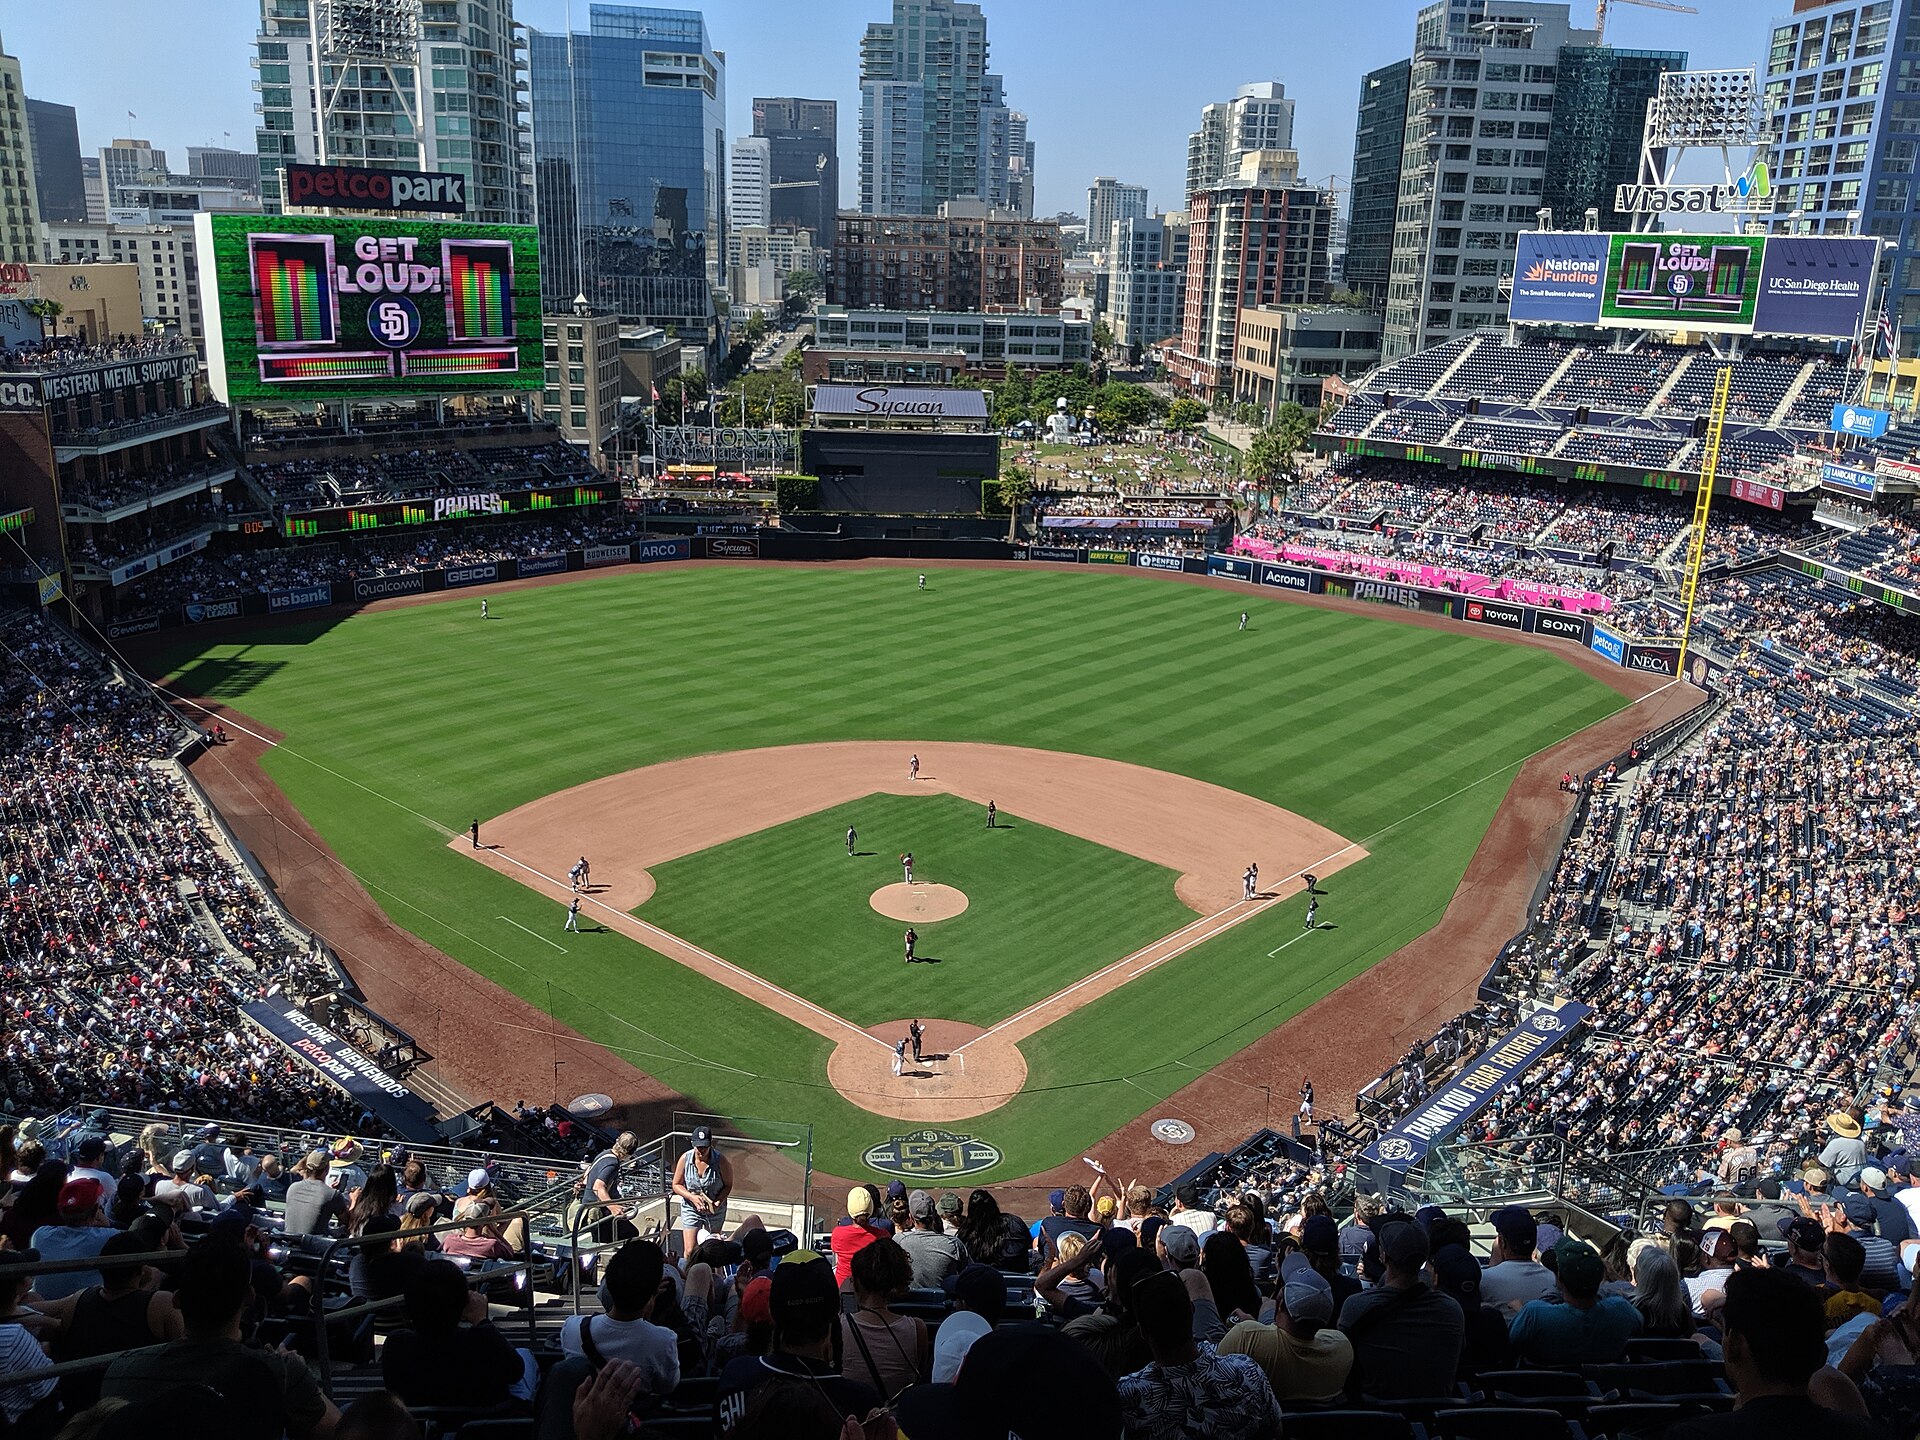
Petco Park, San Diego. The first five innings total is priced off two starters, and this season the market has been right about how much that is worth. Photo: Mds08011, CC BY 4.0, via Wikimedia Commons.
The half number sits on a distribution with a fat left shoulder. Three runs is the single most common combined first five total in baseball this season.
| Combined runs through 5 | Games | Share |
|---|---|---|
| 0 | 102 | 4.84% |
| 1 | 168 | 7.97% |
| 2 | 239 | 11.34% |
| 3 | 285 | 13.52% |
| 4 | 261 | 12.38% |
| 5 | 239 | 11.34% |
| 6 | 199 | 9.44% |
| 7 | 180 | 8.54% |
| 8 or more | 435 | 20.63% |
| All games | 2,108 | 100% |
Four or fewer is 1,055 of 2,108. Everything at five or above is the other 1,053. The reason a 4.5 first five behaves so differently from a 4.5 team total is right there in the shape: this distribution has real weight at zero and one, and it also has a 20.63 percent tail at eight or more that pays for all of it.
Take the 81 pitchers with 15 or more starts this season and mark every game where both starters came from that group. That is 432 games, about one in five of the season, and it is the closest thing available to a set of games that were actually started rather than covered.
| Sample | Games | Mean first five total | Under 4.5 |
|---|---|---|---|
| All 2026 games | 2,108 | 4.99 | 50.05% |
| Both starters 15+ GS | 432 | 4.07 | 65.7% |
Almost a full run comes off the number and the under rate goes from a coin flip to two in three. That gap is not subtle and it is not a small sample artefact at 432 games. Established starters suppress early scoring, and the games they are both in are structurally lower than the league.
Some of that is the pitchers and some of it is selection. A man makes 15 starts because he has not been removed from a rotation, and rotations remove the people who give up runs in the third inning. The finding does not separate the two and it should not be read as if it does.
Inside those 432 games, split on the average season ERA of the two starters. This is the part that decides whether a first five under is worth a big price.
| Average ERA of the two starters | Games | Mean first five total | Under 4.5 |
|---|---|---|---|
| Better than 2.75 | 31 | 3.00 | 74.2% |
| 2.75 to 3.25 | 121 | 3.62 | 70.2% |
| 3.25 to 3.75 | 194 | 4.11 | 64.9% |
| 3.75 to 4.25 | 86 | 4.99 | 58.1% |
Monotone in both columns, with no reversals. Every step down the ERA ladder costs about half a run of expected first five scoring and roughly five points of under rate. At the top of the ladder, two starters averaging better than a 2.75 ERA, the combined first five total lands at 3.00 runs and the under 4.5 cashes 74.2 percent of the time.
Notice what 74.2 percent equals in price terms. A ticket that wins 74.2 percent of the time breaks even at -287. The alternate first five unders in that spot have been priced between -280 and -320 all season. The market is not leaving anything on this table. It has the gradient and it has priced the top of it to within a few cents of the historical rate.
Three things follow from the table and only three.
One. The pitching story is real. Conditioning on two established starters is worth 15 points of under rate over the league base, and conditioning further on their ERA is worth another eight to sixteen on top of that. A first five under is a pitching bet in the literal sense that the pitching explains most of the movement.
Two. Being right about the direction is not the same as being paid for it. The 74.2 percent bucket breaks even at -287 and gets offered near -300. Anyone shopping alternate first five unders in ace against ace matchups is buying a real edge at a price that has already absorbed it, which means the whole return lives in the last few cents of the line.
Three. The main line is where the sample says the disagreement should be. The standard first five total sits at 3 or 3.5 in these games, near the 3.00 to 3.62 means in the top two buckets, and it trades close to even money. Moving off that number to buy a half run of cushion costs about 150 cents of juice and buys about eight points of hit rate. Whether that trade is good is arithmetic, not opinion, and it is close.
The top bucket is 31 games. A binomial standard error on 74.2 percent at n equals 31 is 7.9 points, so the honest reading of that cell is somewhere between 66 and 82 percent, and the price sits inside that interval. The second bucket at 121 games is the sturdier number and it says 70.2 percent, which breaks even at -236.
Everything here also uses full season ERA applied backwards to every start, including the starts that produced it. A 2.06 ERA in September is partly built from the games in the sample. That circularity inflates the top bucket more than the bottom one, because a pitcher stays in the sub 2.75 group by throwing the shutouts that are being counted.
How This Was Built
- Game sample
- Every 2026 regular season game returned by the MLB Stats API schedule endpoint for all 30 clubs between March 1 and September 3 with a final status and at least five innings on the linescore. Deduplicated by gamePk to 2,108 games. Suspended and shortened games with fewer than five innings are dropped.
- First five total
- The sum of the home and away runs in linescore innings 1 through 5, taken from the published linescore rather than reconstructed from play by play.
- Starter pool
- The 81 pitchers credited with 15 or more games started in the 2026 regular season by the season pitching stats endpoint.
- Starter to game mapping
- Each of those 81 pitchers' game logs, keeping only entries where gamesStarted equals 1. A game enters the conditioned sample only when both of its starters are in the pool, which is 432 games.
- ERA bands
- The unweighted mean of the two starters' full season ERA, bucketed at 2.75, 3.25, 3.75 and 4.25.
- Break even
- American price implied from the hit rate as p over 1 minus p, expressed as a minus number. 74.2 percent is -287, 70.2 percent is -236.
What is not checked, and cannot be:
- Full season ERA is applied backwards to every start including the ones that produced it. This inflates the best bucket, because a pitcher stays under a 2.75 ERA by throwing the low scoring games being counted.
- The top bucket is 31 games. The standard error is 7.9 points and the offered price sits inside that interval.
- Nothing controls for park, weather, opposing lineup quality, bullpen usage the night before, or whether a starter was on a pitch limit.
- Requiring both starters to have 15 or more starts selects for health and for competence at the same time, and the study cannot separate the pitching effect from the survivorship.
- No closing lines are used. The comparison to -287 and -300 is against prices observed on a screen, not against a settled market average.
- September call up rotations are in the sample for the last week and those starters are not in the qualified pool, so late season games are underrepresented in the conditioned set.
- Nothing here says which side of any particular game to take.