Five Unders On One Night Is Not One Bet
Somebody builds a card with five unders on it and the reply writes itself. You are not making five bets, you are making one bet on a quiet night. Cold air, a wide zone, a league wide lull, and all five tickets die together. It is one of the most repeated warnings in this hobby and almost nobody has checked the size of it.
It is checkable. There are 149 completed dates in the 2026 regular season through August 27, 2,000 games and 4,000 team games. If a quiet night is a real leaguewide force, the number of teams held to three runs or fewer should swing from day to day by more than chance alone allows. Here is what it actually does.
Three rates anchor everything below. They come from every completed regular season game this year, no filtering by park, weather, pitcher or price.
| Measure | 2026 rate | Sample |
|---|---|---|
| Team held to 3 runs or fewer | 45.07% | 4,000 team games |
| Game total finished under 7 | 32.20% | 2,000 games |
| Average combined runs | 8.93 | 2,000 games |
Now the question. If you had picked four team totals at random on four different games on the same night, how often would all four have landed together compared to what independence predicts?
Take each date and count the share of team games held to three or fewer. If every team game were an independent coin at 45.07 percent, the day to day variance of that share would be exactly the binomial variance. If quiet nights are real, the observed variance has to be larger, because the whole slate drifts together.
| Quantity | Value |
|---|---|
| Mean daily share held to 3 or fewer | 45.07% |
| Observed variance of the daily share | 0.00857 |
| Variance predicted by independent coins | 0.00922 |
| Overdispersion ratio | 0.93x |
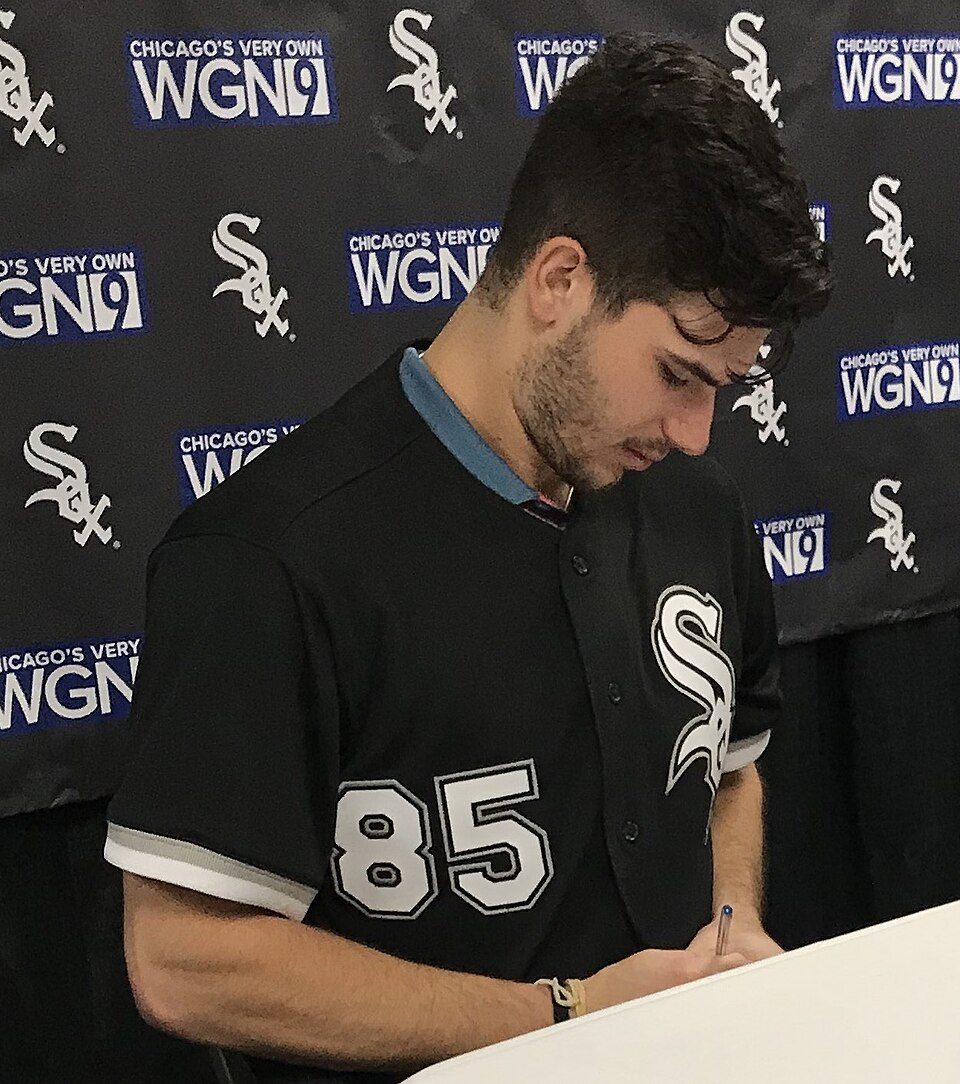
Dylan Cease carries a 2.37 ERA and 13.03 strikeouts per nine into Toronto on Friday. A single arm like this moves one game and does nothing to the other fourteen. Photo: Jmar Gambol, Wikimedia Commons, CC BY 2.0
Overdispersion is an indirect test. The direct one is to take every pair of team game outcomes that happened on the same date in different games, and compute the correlation of the indicator for held to three or fewer. Pairs inside the same game are excluded, because a pitcher's duel obviously links the two halves of one scoreboard and that is not the claim being tested.
| Pairing | Pairs measured | Correlation |
|---|---|---|
| Team held to 3 or fewer, same date, different games | 51,708 | minus 0.0029 |
| Game total under 7, same date, different games | 12,927 | plus 0.0094 |
Both numbers round to zero. The team total version is very slightly negative and the game total version is very slightly positive, which is what noise looks like when you have fifty thousand pairs and no real effect. There is no leaguewide quiet night hiding in this data at any size worth acting on.
The practical claim behind the warning is about variance, not about expected value. Correlated tickets do not change what a card is worth, they change how wide the outcomes scatter. So price the warning in the only currency that matters.
| Five ticket under card | Standard deviation of winners |
|---|---|
| Assuming full independence | 1.113 tickets |
| Using the measured correlation | 1.106 tickets |
| Difference | 0.6 percent |
Six tenths of one percent. That is the entire cost of the thing people say out loud as if it were a structural flaw in the card. If you were going to pass on a fifth under because four were already down, the number says you were passing for a reason worth less than a rounding error.
League scoring per team per day in 2026 has a mean of 4.48 runs and a standard deviation of 0.66. The quietest date of the season was May 21 at 2.64 runs a team. The loudest was April 13 at 7.20. Those are enormous swings and they are the reason the warning sounds so obviously true.
| Slice of the season | Team games held to 3 or fewer |
|---|---|
| The ten percent of dates with the lowest scoring | 59.5% |
| Full season | 45.1% |
| The ten percent of dates with the highest scoring | 33.9% |
That table is true and it is also circular, which is exactly the trap. Sorting dates by how much scoring happened and then reporting how much scoring happened is not a finding. The question is whether you could have known in advance which decile you were about to bet into, and the variance test above says you could not, because the day to day spread never exceeds what independent games would produce on their own.
Put both facts together and the picture is coherent. Some nights really are quiet. Those nights are quiet because fifteen separate pitching matchups happened to break the same way, not because a single force acted on all of them. Fifteen independent coins produce lopsided nights all the time and produce them at exactly the rate observed here.
One. Stop discounting an under because you already have unders. The correlation penalty on a five ticket card is 0.6 percent of one standard deviation. Size each ticket on its own merits and let the count land wherever it lands.
Two. Do apply a real discount inside a single game. Two unders on the same scoreboard, a team total and a game total, are genuinely linked and belong at reduced size relative to two tickets in different cities.
Three. If you want to reduce variance, the lever is position sizing, not diversification across game types. A card that risks 3.10 units on one ticket and 1.05 on another carries far more scatter from that imbalance than from any correlation between the two.
How This Was Built
- Sample
- Every completed 2026 regular season game from March 20 through August 27 in the MLB Stats API schedule endpoint with linescore hydration. Dates carrying fewer than six completed games were dropped so that a daily share is meaningful, leaving 149 dates, 2,000 games and 4,000 team games.
- Held to 3 or fewer
- Final runs scored by each club, counted once per club per game. Team totals in the market are usually priced at 3.5, so three or fewer is the winning side of that number.
- Overdispersion
- Weighted variance of the observed daily share against the weighted mean of the per date binomial variance p(1-p)/n at the season rate. A ratio above 1.0 indicates clustering.
- Correlation
- Mean cross product of centered indicators over every same date pair drawn from two different games, divided by p(1-p). Pairs inside a single game are excluded.
- Card variance
- Standard deviation of the winner count on a five ticket card, computed as the square root of n p (1-p) (1 + (n-1) rho) at the measured rho.
What is not checked, and cannot be:
- This is realized correlation, not priced correlation. If the market already moves every total on a cold night, the correlation you actually face after buying at those prices is a different quantity.
- One season. Weather patterns, the ball and the strike zone all change between years, and a 2019 or a 2022 sample could read differently.
- Team totals are treated as a flat three or fewer. Real tickets sit at 3.5, 4.5 and elsewhere, and the correlation could differ by line.
- Nothing controls for park, roof status, temperature or umpire. A slate that happens to load into three domes is a different animal and this method cannot see it.
- The five ticket variance figure assumes every ticket carries the same win probability. Real cards do not.
Related reading
The bullpen tax on a team total under
Betting glossary: team totals, implied probability and how American odds convert
Related reading
A -1 Run Line Pushes 15 Percent Of The Time, And Almost Nothing Clears What It
Yankee Stadium in the Bronx. A -1 run line gives the money back when the favorite wins by exactly one, which happened in 338 of …
The Push Is The Product: 27.27 Percent Of 2026 MLB Games Are One Run Games
Everybody knows the run line as -1.5. Lay a run and a half, get plus money, lose the ticket when your team wins 4 to 3. It is th…
Baseball Totals Land On Odd Numbers 57.87 Percent Of The Time
Every totals market gives you a choice you rarely think about. You can take 7.5 or you can take 8. The half run costs about fift…
Why lines move
What moves a number after it opens, who moves it, and which explanations do not survive contact with the data.
Bet types and situational edges
What each bet type actually costs, and which situational angles hold up.
Related reading
A -1 Run Line Pushes 15 Percent Of The Time, And Almost Nothing Clears What It
Yankee Stadium in the Bronx. A -1 run line gives the money back when the favorite wins by exactly one, which happened in 338 of …
The Push Is The Product: 27.27 Percent Of 2026 MLB Games Are One Run Games
Everybody knows the run line as -1.5. Lay a run and a half, get plus money, lose the ticket when your team wins 4 to 3. It is th…
Baseball Totals Land On Odd Numbers 57.87 Percent Of The Time
Every totals market gives you a choice you rarely think about. You can take 7.5 or you can take 8. The half run costs about fift…
Why lines move
What moves a number after it opens, who moves it, and which explanations do not survive contact with the data.
Bet types and situational edges
What each bet type actually costs, and which situational angles hold up.