The First Five Innings Score At The Same Rate As The Whole Game
The whole case for a first five innings under is supposed to be obvious. You get the two starting pitchers and none of the bullpen, and bullpens are where games get loud. Buy the good half of the game, skip the bad half.
That story is wrong on the league level, and it is wrong by a margin small enough that almost nobody checks it. Over 2,070 games this season the first five innings scored at essentially the identical rate as the full nine. Not lower. If anything a hair higher.
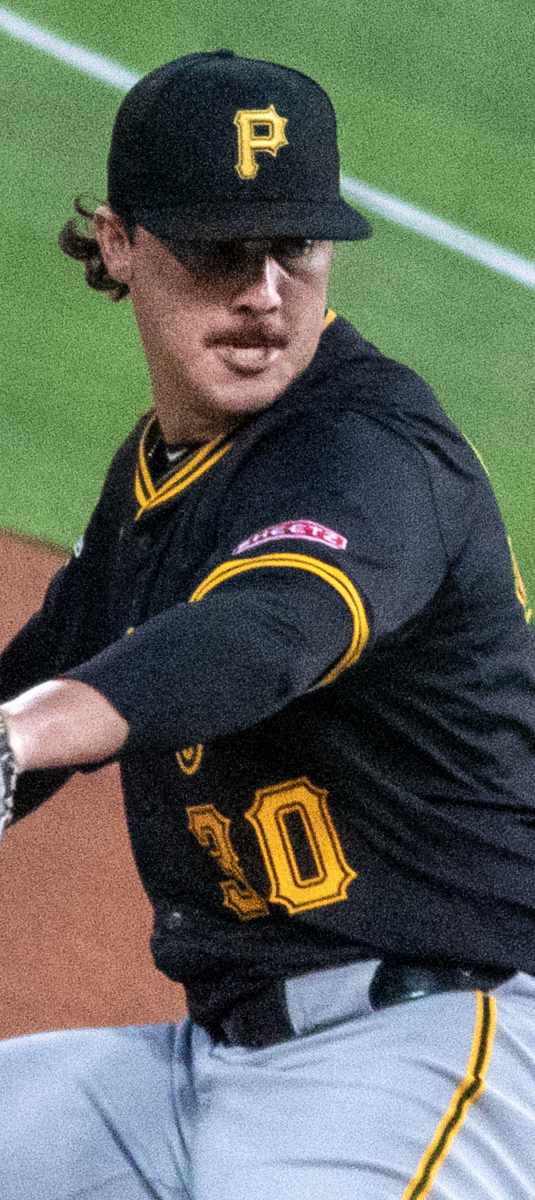
Paul Skenes takes the ball at PNC Park tonight opposite Logan Webb, the exact kind of matchup the first five market exists for. The league baseline says that matchup, not the market structure, is where any edge has to come from. Photo: MLB.
The sample is 2,070 games, every 2026 regular season game in the MLB Stats API from March 25 through August 31 that carried a Final status and a complete five inning linescore. No prices, no models, only runs.
| Segment | Innings | Combined runs per game | Runs per inning |
|---|---|---|---|
| First five innings | 5 | 4.983 | 0.997 |
| Full game | 9 | 8.935 | 0.993 |
The first five innings carry 55.76 percent of all the runs scored in a season, out of 55.6 percent of the innings. That is a gap of about two tenths of one percent, which on this sample is nothing at all.
The intuition fails for a reason worth naming. A starting pitcher is better than a reliever on average, but he also faces the lineup two and sometimes three times in those five innings, and the third time through is where his edge disappears. A reliever is worse on average and faces four batters once. Those two effects very nearly cancel, and the scoreboard says so.
Here is the whole distribution. This is the share of games finishing on each exact combined total through five innings, which is also the push rate for a whole number first five total set there.
| Runs through five | Games | Share |
|---|---|---|
| 0 | 99 | 4.78% |
| 1 | 167 | 8.07% |
| 2 | 238 | 11.50% |
| 3 | 277 | 13.38% |
| 4 | 255 | 12.32% |
| 5 | 234 | 11.30% |
| 6 | 198 | 9.57% |
| 7 | 176 | 8.50% |
| 8 | 138 | 6.67% |
| 9 or more | 288 | 13.91% |
Run that into the half run numbers a book posts and the picture is blunt.
| First five under | Hits | Share |
|---|---|---|
| Under 2.5 | 504 of 2,070 | 24.35% |
| Under 3.5 | 781 of 2,070 | 37.73% |
| Under 4.5 | 1,036 of 2,070 | 50.05% |
| Under 5.5 | 1,270 of 2,070 | 61.35% |
| Under 6.5 | 1,468 of 2,070 | 70.92% |
Under 4.5 is a coin flip. 1,036 of 2,070, which is 50.05 percent, about as close to even as a 2,070 game sample can land. So any price on a first five under 4.5 is being paid entirely for the matchup in front of you. At -154 the number has to clear 60.63 percent, which is more than ten points above the league baseline. That is not a small ask and no amount of general first five theory covers it. Two starters have to be genuinely different from the average two starters.
There is a real structural difference, and it is not the scoring rate. It is the push.
| Whole number | First five push rate | Full game push rate |
|---|---|---|
| 3 | 13.38% | n/a, market does not go there |
| 4 | 12.32% | n/a |
| 5 | 11.30% | n/a |
| 6 | 9.57% | 7.09% |
| 7 | 8.50% | 11.37% |
| 8 | 6.67% | 8.26% |
A whole number first five total in the range the market actually posts, which is 3 to 5, refunds between 11.30 and 13.38 percent of the time. A whole number full game total refunds between 6.66 and 11.37 percent. The half run is worth more over five innings than it is over nine, and it is worth the most exactly where first five totals live.
The reason is that the distribution is compressed. Fewer possible outcomes, more mass on each one. Three runs through five is the single most likely result in baseball at 13.38 percent, more likely than any exact full game total.
Yesterday's study found that full game combined totals land odd 57.87 percent of the time, because a game cannot end level and a one run margin always produces an odd sum. That effect is one of the more reliable structural facts in baseball totals.
It does not exist through five innings. The first five combined total landed odd on 49.08 percent of games, which is a coin flip inside the noise band on this sample.
The mechanism explains itself. The parity gap comes from the game being forced to end unequal. Through five innings there is no such constraint. Both teams have batted, the score is allowed to be tied, and roughly a fifth of games are tied at that point. Take away the forced inequality and the parity gap goes with it.
The practical consequence: every rule of thumb about which whole number totals to reach for, built on the odd bias, applies to full game numbers only. Carrying it into the first five market is carrying an effect that is not there.
How This Was Built
- Sample
- Every 2026 regular season game in the MLB Stats API schedule endpoint from March 25 through August 31, 2026 with a Final status and a linescore carrying at least five completed innings for both sides. That is 2,070 games. Nothing else was excluded and no game was weighted.
- First five combined runs
- Away runs plus home runs summed across linescore innings one through five, taken directly from the published linescore.
- Full game combined runs
- The final away and home scores added together, extra innings included at face value.
- Push rate
- The count of games whose first five combined total equals exactly that whole number, divided by 2,070. This is the empirical push frequency for a first five total set there, before any price.
- Runs per inning
- Combined runs divided by innings. The full game figure divides by nine for every game including the ones that went longer, so it is if anything generous to the full game side of the comparison.
- Parity
- Odd or even on the combined first five total. The binomial standard error on 2,070 observations at a 50 percent base rate is 1.10 points.
What is not checked, and cannot be:
- No prices anywhere. Every figure is an outcome frequency. A 12.32 percent push rate is worth a different amount of money at -105 than at -154 and none of that is measured here.
- One season. 2,070 games is five months. The scoring rate parity between the first five and the full game would need several seasons before it could be called a structural constant.
- The league baseline says nothing about any single matchup. Two starters at a 1.10 WHIP are not the average two starters and the whole point of the market is that they are not.
- A home team leading after five in a game it never trails still bats in the fifth, but the ninth inning asymmetry that drives the full game parity gap has no equivalent here. That is the finding, not a control.
- Park, weather, umpire and roster effects are ignored entirely.
- Bullpen usage is not separated. The claim is only that the first five and the full game score at the same rate, not that starters and relievers are equally good.
- Nothing here says which side of a first five number to take.