What The Push Buys At Sutter Health Park
The Athletics host the Twins in Sacramento tonight and there are two ways to buy the same opinion. The main number is 10.5 and the over is priced at -102. The alternate is 10, where the over costs -120. Eighteen cents of extra juice, and in exchange the number 10 stops being a loss and becomes a refund.
Almost everybody treats that trade as obviously bad. Paying up for a hook is what square money does. Sixty five completed home dates at Sutter Health Park this season say otherwise, by a margin too small to be free and too clear to ignore.
Both tickets win on 11 or more and both lose on 9 or fewer. The entire difference between them is what happens on exactly 10. On the 10.5 that is a loss. On the 10 the stake comes back.
| Combined runs | Over 10 at -120 | Over 10.5 at -102 |
|---|---|---|
| 11 or more | Win 0.833 per unit risked | Win 0.980 per unit risked |
| Exactly 10 | Push, stake returned | Loss |
| 9 or fewer | Loss | Loss |
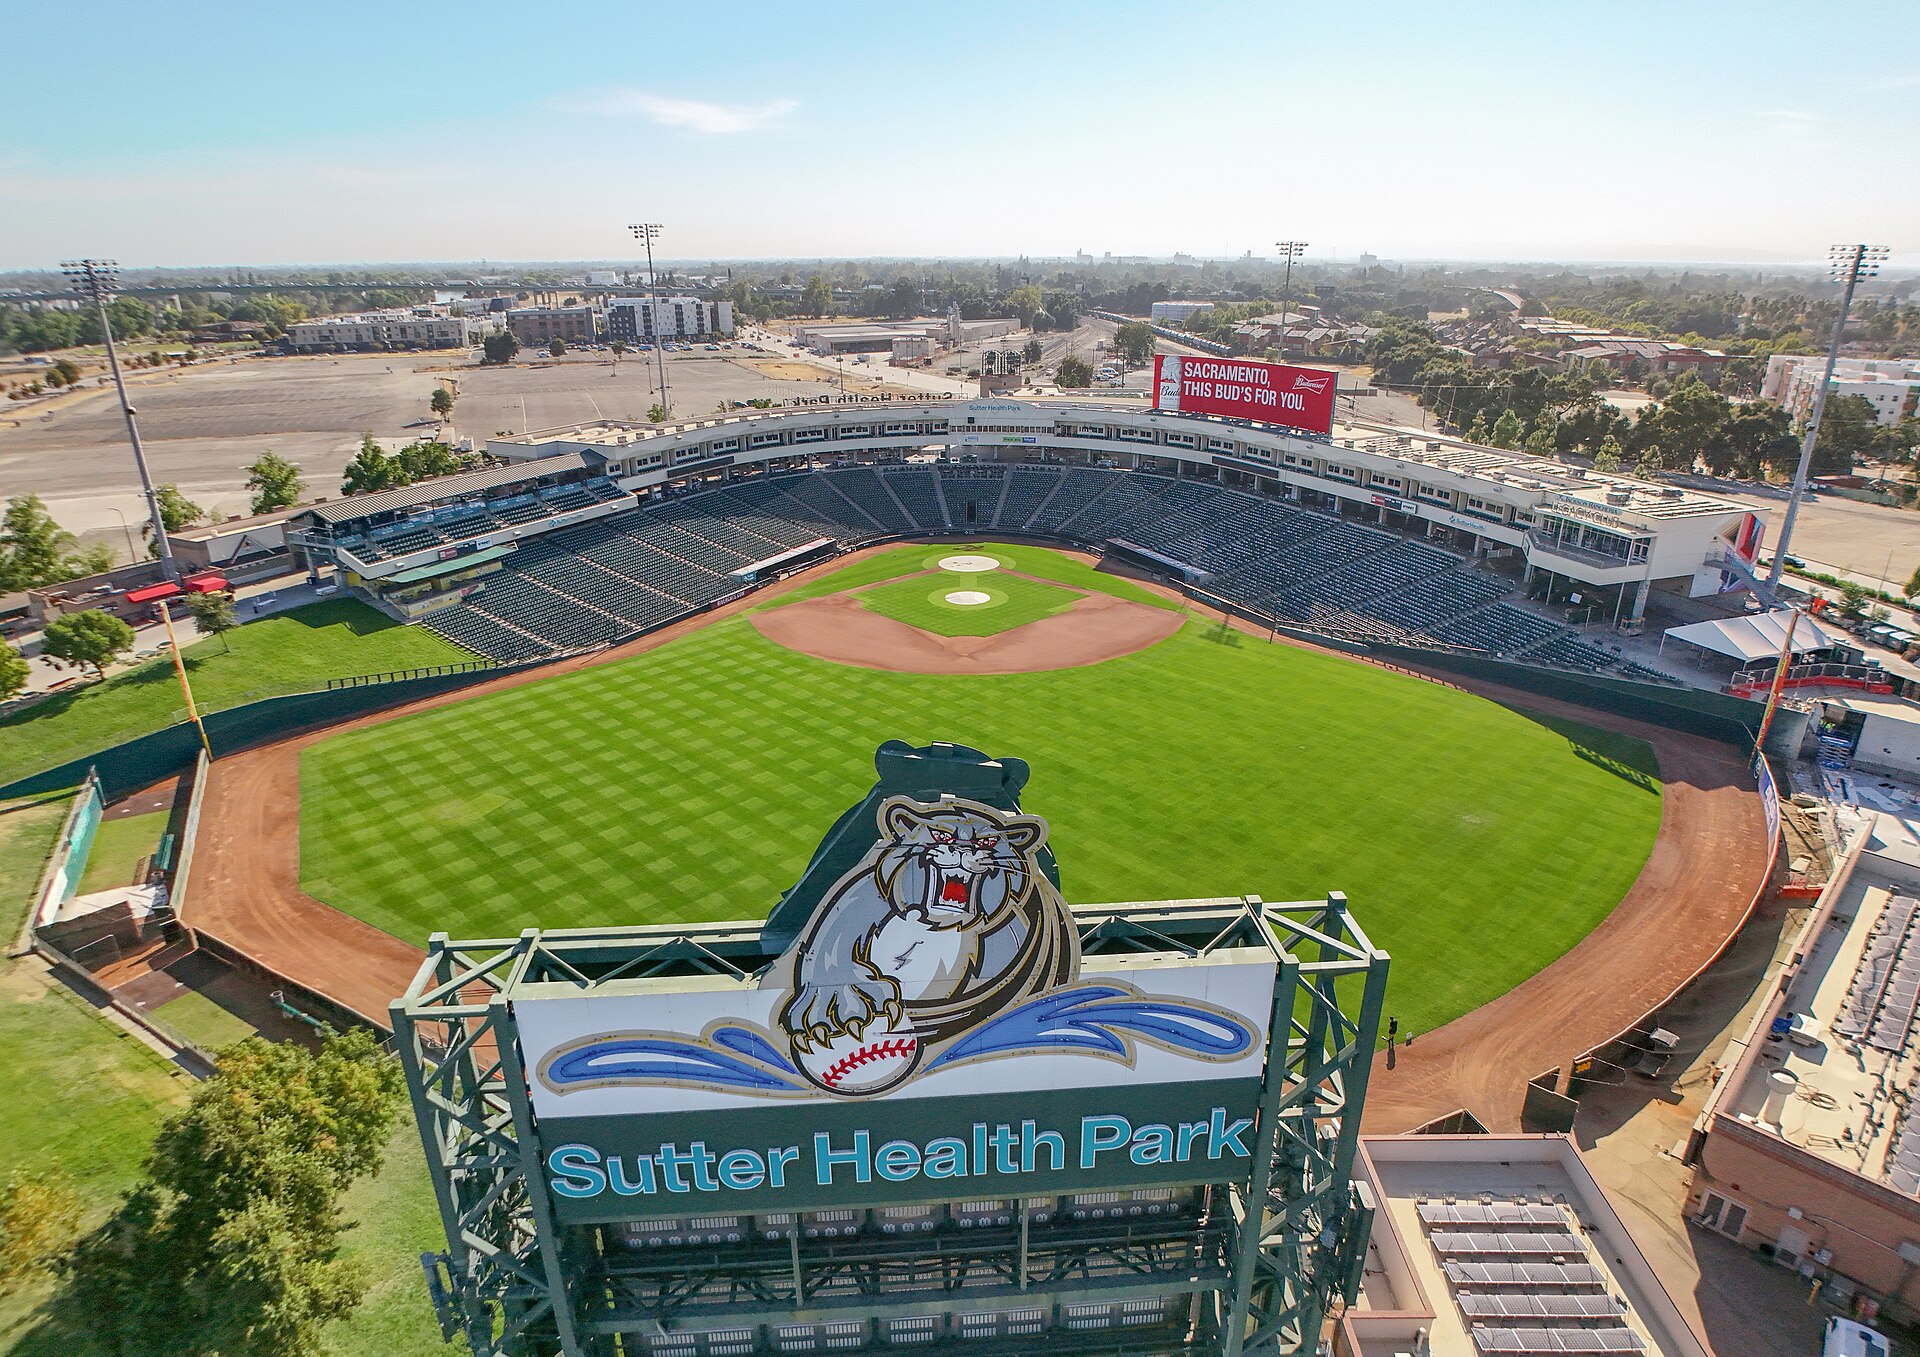
Sutter Health Park in Sacramento. Sixty five completed Athletics home dates this season have averaged 12.03 combined runs. Photo: Quintin Soloviev, Wikimedia Commons, CC BY 4.0
Every completed Athletics regular season home game this year, scored by combined runs. No projection, no model, just the finals.
| Bucket | Games | Share |
|---|---|---|
| 11 or more | 36 | 55.4% |
| Exactly 10 | 6 | 9.2% |
| 9 or fewer | 23 | 35.4% |
| Total | 65 | 100% |
The average is 12.03 combined runs a game. The distribution is not a tidy bell either: seven games finished on exactly 7, and the top of the range runs 20, 21, 22, 23, 27, 29 and 32. A park that produces a 32 run game in a season is not being described well by any smooth curve.
Apply those three frequencies to both prices. Expected value is stated per unit risked, which is the only way to compare two tickets carrying different juice.
| Ticket | Win | Push | Lose | EV per unit risked |
|---|---|---|---|---|
| Over 10 at -120 | 55.4% | 9.2% | 35.4% | +0.108 |
| Over 10.5 at -102 | 55.4% | 0% | 44.6% | +0.097 |
The lower number with the worse price wins by about a penny per unit risked. That is roughly 1.1 percent of stake, which on a 1.8 unit position is about two hundredths of a unit. Real, but nobody should pretend it is dramatic.
The more useful number is the indifference price. Holding the 10.5 at -102 fixed, the over 10 stays the better ticket up to about -123. Past that the extra juice costs more than the push is worth and the main number takes over.
| Price on over 10 | EV per unit risked | Better than 10.5 at -102? |
|---|---|---|
| -110 | +0.149 | Yes |
| -120 | +0.108 | Yes |
| -123 | +0.096 | Line ball |
| -135 | +0.056 | No |
| -150 | +0.015 | No |
A push is worth buying in proportion to how often the exact number lands, and that is a function of where the total sits inside the distribution. Ten is close enough to the middle of Sacramento outcomes to get hit often. Move a total out to 13 or 14 and the exact number lands rarely enough that the hook is close to worthless.
It also matters that these frequencies come from a genuinely unusual sample. Two staffs carrying a 5.47 and a 4.67 ERA, a minor league park, and a hot valley in late August is not a run environment that generalizes to Citi Field or Truist Park. Run this same math on league average frequencies and the answer flips, because a league average game does not land on 10 nine percent of the time.
If the two prices sit where they are tonight, take the 10 and the push. If the over 10 gets shopped past about -125 while the 10.5 holds near even money, the main number is the better ticket and the hook stops being worth the tax.
None of that is an argument that the over is right. It is an argument about which of two ways to express it costs less, and that question has an answer without needing an opinion at all.
How This Was Built
- Run data
- Every completed Athletics regular season home game in 2026 through August 25, 65 games, from the MLB Stats API. Combined final runs only.
- Prices
- Over 10 at -120 as posted, and the 10.5 at -102 as carried on the market board the afternoon of August 26, 2026.
- Expected value
- Win probability times decimal profit, minus loss probability, per unit risked. A push contributes zero.
- Indifference price
- The over 10 price at which its EV per unit risked equals the 10.5 ticket, holding the observed frequencies fixed.
Everything on this page is arithmetic on finals and posted prices. No model ran and no probability was estimated.
What is not checked, and cannot be:
- Sixty five games is a season, not a law. The observed 9.2 percent rate on exactly 10 carries real sampling error and the true rate could sit several points either side of it.
- Tonight frequencies are not tonight probabilities. The two starting pitchers, the weather and the bullpens are not in this arithmetic anywhere.
- No view is expressed on whether the over is the correct side. This compares two ways to buy the same opinion.
- Prices move. The comparison holds only while the over 10 sits near -120 and the 10.5 near -102.
- No ticket count or money percentage split was pulled. Sports Betting Prime stopped publishing consensus data on July 21, 2026 and has not resumed it.
- Nothing here addresses bankroll size or correlated exposure, both of which sit upstream of a hook decision and matter more than it does.
Related reading
Betting glossary: pushes, hooks, and how American odds convert
Related reading
A -1 Run Line Pushes 15 Percent Of The Time, And Almost Nothing Clears What It
Yankee Stadium in the Bronx. A -1 run line gives the money back when the favorite wins by exactly one, which happened in 338 of …
The Push Is The Product: 27.27 Percent Of 2026 MLB Games Are One Run Games
Everybody knows the run line as -1.5. Lay a run and a half, get plus money, lose the ticket when your team wins 4 to 3. It is th…
Baseball Totals Land On Odd Numbers 57.87 Percent Of The Time
Every totals market gives you a choice you rarely think about. You can take 7.5 or you can take 8. The half run costs about fift…
Why lines move
What moves a number after it opens, who moves it, and which explanations do not survive contact with the data.
Bet types and situational edges
What each bet type actually costs, and which situational angles hold up.
Related reading
A -1 Run Line Pushes 15 Percent Of The Time, And Almost Nothing Clears What It
Yankee Stadium in the Bronx. A -1 run line gives the money back when the favorite wins by exactly one, which happened in 338 of …
The Push Is The Product: 27.27 Percent Of 2026 MLB Games Are One Run Games
Everybody knows the run line as -1.5. Lay a run and a half, get plus money, lose the ticket when your team wins 4 to 3. It is th…
Baseball Totals Land On Odd Numbers 57.87 Percent Of The Time
Every totals market gives you a choice you rarely think about. You can take 7.5 or you can take 8. The half run costs about fift…
Why lines move
What moves a number after it opens, who moves it, and which explanations do not survive contact with the data.
Bet types and situational edges
What each bet type actually costs, and which situational angles hold up.