NFL Road Underdogs Of 1.5 To 2.5 Lose By Exactly 3 More Often Than By 1 And 2 Combined
Monday night's card has two tickets on the same team. Denver Broncos +1.5 at -110 and Denver Broncos team total over 20.5 at -120, with the Broncos visiting Kansas City. The market around town has the Chiefs at 2.5, so the spread ticket is a point shorter than the best number out there, and the team total sits right on top of 20, the single most common score in the sport.
Both tickets raise a question you can actually answer with a spreadsheet. How much does that missing point cost a short road underdog? And how often does a road team the market prices for about 20 points get to 21? So we counted.
What we measured
Every NFL regular season game from September 10 2015 through January 4 2026, 2,895 games. We start in 2015, the first season with the longer extra point. For the spread question we kept the 246 games where the road team closed as an underdog of 1.5, 2 or 2.5 points. For the team total question we took every road team whose implied points landed between 19.75 and 20.75, which is half the closing total less half the closing spread. That's 341 games. Denver's implied number on Monday, from a 2.5 spread and a total of 42.5 to 43, is 20 to 20.25.
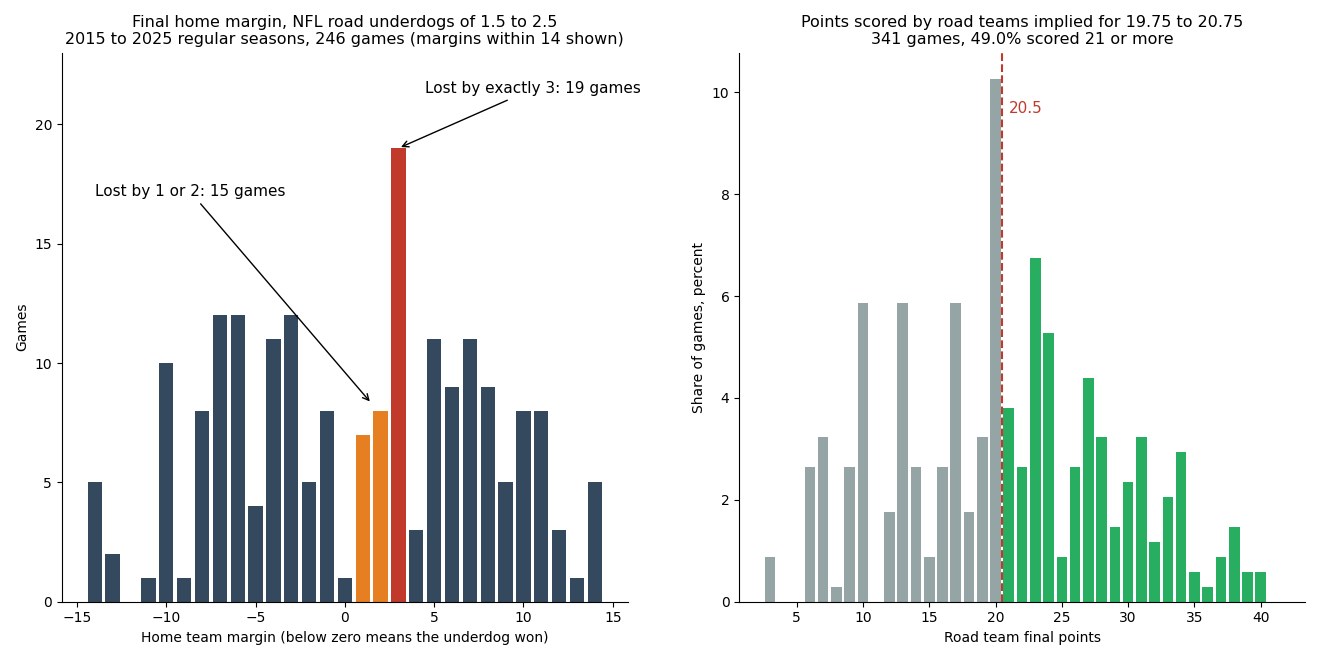
The point that matters is 3, not 2
| Road underdogs of 1.5 to 2.5, 246 games | Games | Share |
|---|---|---|
| Won outright | 116 | 47.2% |
| Lost by exactly 1 | 7 | 2.8% |
| Lost by exactly 2 | 8 | 3.3% |
| Lost by exactly 3 | 19 | 7.7% |
| Covered +1.5 | 124 | 50.4% |
| Covered +2.5 | 132 | 53.7% |
| Covered +3.5 | 151 | 61.4% |
That's the whole spread study in one line: these teams lost by exactly three points more often than they lost by one or two combined, 19 games against 15. Going from +1.5 to +2.5 bought 3.3 percentage points of cover rate. Going from +2.5 to +3.5 would've bought 7.7 more. A bettor holding +1.5 instead of +2.5 gave up something real, but the expensive number sits one point further out, and neither ticket owns it.
At -110 a spread bet needs 52.38 percent. Across all 246 games, +1.5 cashed 50.4 percent. On the base rate alone, a short road underdog at +1.5 is a small losing proposition. That's the honest starting line.
Where the base rate moves
| Subset of the 246 games | Games | Covered +1.5 | Covered +2.5 |
|---|---|---|---|
| All road underdogs of 1.5 to 2.5 | 246 | 50.4% | 53.7% |
| Closed at exactly 2.5 | 159 | 51.6% | 55.3% |
| Division games | 79 | 59.5% | 60.8% |
| Week 1 | 20 | 65.0% | 65.0% |
| Monday games | 13 | 76.9% | 76.9% |
Division games are the subset worth taking seriously. Seventy nine games isn't a huge sample, but 47 covers at +1.5 is well clear of the 52.38 percent break even, and one plausible reason is familiarity: teams that see each other twice a year tend to keep these games close. Only one of those 79 games was lost by exactly two, so the missing point barely touched this group.
The Week 1 and Monday rows look exciting and aren't worth much. Twenty games and thirteen games are too few to lean on, and we're showing them so nobody has to wonder.
The team total sits on a cliff
| Road teams implied for 19.75 to 20.75, 341 games | Share over |
|---|---|
| Over 17.5 | 64.2% |
| Over 19.5 | 59.2% |
| Over 20.5 | 49.0% |
| Over 21.5 | 45.2% |
| Over 23.5 | 35.8% |
Look at the jump between 19.5 and 20.5. It's about 10 percentage points, and all of it is one number: these teams finished on exactly 20 in 35 of 341 games. They finished on 21 only 13 times. So a team total of 20.5 isn't just a line near the middle. It's a line set a half point above the most crowded spot on the board, which is why the price on the over matters so much.
At -120 the over needs 54.55 percent. The base rate is 49.0. Restrict it to road underdogs of 1.5 to 2.5 inside the same implied band and it's 28 of 56, exactly 50.0. On numbers alone this ticket is underwater by more than five points, and anyone holding it is betting that this particular game is different from the average one.
Why the two tickets belong together
Here's the part that ties them up. Among the 246 short road underdogs, the ones that scored 21 or more covered +1.5 in 85 of 124 games, 68.5 percent. The ones held under 21 covered in 39 of 122, 32.0 percent. The two outcomes travel together. If Denver gets to 21 on Monday, the spread ticket is in good shape, and if Denver is held to 20 or fewer, both tickets are probably in trouble at the same time.
So the pair isn't two independent opinions. It's one opinion, that the Broncos offense shows up at Arrowhead, sized at 2.85 units of risk. The study says that opinion has to be right more often than the average short road underdog to pay, and it says the division angle on the spread is the stronger of the two.
What this study does not tell you
It doesn't know who's playing. Patrick Mahomes returns from his knee injury on Monday, Kansas City has ruled out left tackle Josh Simmons, and Denver has ruled out outside linebacker Jonathon Cooper and guard Nick Gargiulo, per the ESPN injury report read on September 14. It also can't see the weather, and the forecast for Arrowhead calls for 89 degrees with gusts near 29 miles an hour. Base rates set the bar. The matchup has to clear it.
Method: NFL regular season games from the nflverse schedule file, closing spreads and totals as recorded there, 2015 through 2025. Road underdog means the road team closed as the underdog by 1.5, 2 or 2.5 points. Implied road points equal half the closing total less half the closing spread. One tie in the spread sample is counted as a cover at both +1.5 and +2.5. Monday's numbers: Chiefs 2.5 and 42.5 at DraftKings via ESPN, and a Broncos team total of 20.5, read September 14 2026. Kickoff is 5:15 PM Pacific on September 14.