In 2026 A Team Scoring Half A Run Less On The Road Scored 4.50 Per Road Game, Right At Its Full Season Average
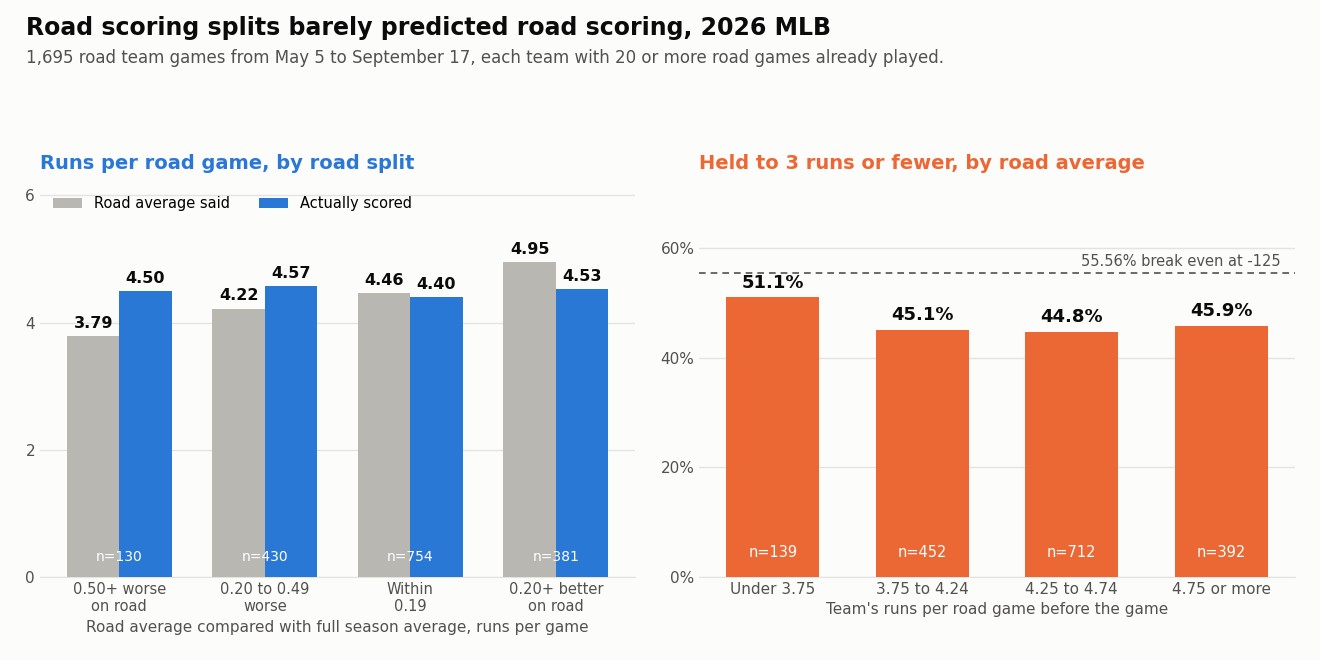
Every team total preview reaches for the same split. This lineup scores 3.59 runs a game on the road, so the road under writes itself. It sounds like the most specific number you could use. So we went back through the 2026 season and tested it the plain way: before every road game, what did the team's road average say it would score, what did its full season average say, and what did it actually score?
The road split lost. Teams scoring half a run or more less on the road than their season average were supposed to score 3.79 by that split. They scored 4.50, almost exactly their full season number of 4.45. Teams that looked half a run better on the road were supposed to score 4.95 and scored 4.53. Over 1,695 road games, the full season average missed the actual score by 2.576 runs on average and the road average missed by 2.588. The more specific number was slightly worse.
What we measured
1,695 road team games from May 5 through September 17, 2026, every road game in which the visiting team had already played at least 20 road games. All 2,295 final scores from Opening Day on were replayed in date order, so each team's road average, its full season average and its opponent's runs allowed are exactly what they were before first pitch. Runs are final runs, extra innings included.
The road split pulls toward the middle
| Road average vs season average | Games | Road average said | Season average said | Actually scored |
|---|---|---|---|---|
| 0.50 or more worse on the road | 130 | 3.79 | 4.45 | 4.50 |
| 0.20 to 0.49 worse | 430 | 4.22 | 4.55 | 4.57 |
| Within 0.19 | 754 | 4.46 | 4.46 | 4.40 |
| 0.20 or more better on the road | 381 | 4.95 | 4.43 | 4.53 |
Read the last column top to bottom and it barely moves, 4.40 to 4.57. Whatever made a team look bad on the road through the first few months didn't follow it into the next road game. Most of what looks like a road split, 30 or 50 games in, looks like the schedule it happened to draw and plain noise.
Held to three or fewer
A team total under 3.5 doesn't care about averages; it cares how often a team gets stuck at three. Across the study the road team was held to three or fewer 774 times in 1,695, 45.7 percent. Split by the road average going in:
| Runs per road game before the game | Games | Scored 3 or fewer | Rate | Scored 4 or fewer |
|---|---|---|---|---|
| Under 3.75 | 139 | 71 | 51.1% | 58.3% |
| 3.75 to 4.24 | 452 | 204 | 45.1% | 57.5% |
| 4.25 to 4.74 | 712 | 319 | 44.8% | 57.4% |
| 4.75 or more | 392 | 180 | 45.9% | 57.4% |
There is one small signal. The genuinely bad road offenses, under 3.75 a game, were held to three or fewer about five points more often than everyone else. But that's 51.1 percent on 139 games, and it doesn't come close to the 55.56 percent a -125 under needs.
The other side of the field says more
Sort the same games by the home team's runs allowed per game instead, and the spread is wider than anything the road split produced:
| Home team runs allowed per game | Games | Road team runs per game | 3 or fewer | 4 or fewer |
|---|---|---|---|---|
| Under 4.00 | 342 | 4.08 | 51.2% | 62.0% |
| 4.00 to 4.49 | 601 | 4.44 | 44.8% | 57.7% |
| 4.50 to 4.99 | 456 | 4.38 | 46.5% | 59.0% |
| 5.00 or more | 296 | 5.17 | 39.9% | 49.7% |
A run a game separates the best and worst run prevention groups. The team you're playing, and above all who's pitching for it, is the number to argue about. The visitor's road split mostly isn't.
Measured at Friday's six tickets
| Ticket | Price | Risk to win | Break even |
|---|---|---|---|
| Guardians -1 vs Athletics | -180 | 5.40 to win 3 | 64.29% of decided bets |
| Blue Jays ML at Rangers | -132 | 1.98 to win 1.5 | 56.90% |
| Royals team total under 3.5 at Pirates | -125 | 1.875 to win 1.5 | 55.56% |
| Braves team total under 4.5 at Astros | -139 | 2.085 to win 1.5 | 58.16% |
| Yankees ML at Diamondbacks | -110 | 2.20 to win 2 | 52.38% |
| Mariners ML at Rockies | -181 | 3.62 to win 2 | 64.41% |
Royals under 3.5 at -125. This is the ticket the study was built for. Kansas City scores 3.59 a game on the road and 4.20 overall, a gap of 0.61, and it's been held to three or fewer in 48 of 78 road games. That's exactly the profile the table says to discount: teams 0.50 or more worse on the road scored 4.50 their next time out and stayed at three or fewer 47.7 percent of the time. Pittsburgh allows 4.61 runs a game, which puts this game in a bucket where visitors were held to three or fewer 46.5 percent of the time. So the split can't carry this bet. Paul Skenes has to, and he might: a 3.78 ERA and 185 strikeouts in 162 innings. The catch is that Pittsburgh's opponents scored three or fewer in only 11 of his 30 starts, because the Pirates' bullpen finishes his games. On our numbers the Royals under needs Skenes to go deep.
Braves under 4.5 at -139. Atlanta's road gap is smaller, 4.37 on the road against 4.60 overall, and teams in that range stayed at four or fewer 55.8 percent of the time. Houston allows 4.78 a game, a group where visitors stayed at four or fewer 59.0 percent. That's already right at the 58.16 percent break even before you look at the pitcher. Peter Lambert, with a 3.71 ERA and a .649 OPS against, has held opponents to four or fewer in 17 of his 26 starts. Of the two unders, this is the one the numbers stand behind.
The four sides. They aren't team total bets, but the same lesson applies: the pitcher and the opponent tell you more than a split. Guardians -1 rests on Mason Barnett's 7.08 ERA, and on a Cleveland team that has won by two or more in 24 of 78 home games. Blue Jays ML rests on Dylan Cease's 2.38 ERA, 1.89 in 13 road starts. Yankees ML at -110 is a bet on an 88 and 64 team with a +136 run differential against Eduardo Rodriguez's 2.62 ERA. Mariners ML at -181 rests on Colorado being 56 and 97, and on Bryan Woo, whose 5.23 road ERA is the split to watch. This study measured offenses, not pitchers, so read that pitching split with the same caution rather than as proof in either direction.
Fact manifest
- 2,295 completed 2026 regular season games from March 25 through September 17 with final scores; 1,695 road team games from May 5 on with the visitor at 20 or more road games played
- MLB Stats API schedule endpoint, gameType R, three date ranges, final scores only, pulled September 18, 2026
- Each team's road runs per game, full season runs per game and the home team's runs allowed per game before every game; the prediction errors of 2.576 and 2.588 runs; all three study tables
- Computed this session by replaying the final scores above in date order
- Friday's probable starters: Randy Dobnak against Paul Skenes at PNC Park, Mason Barnett against Daniel Espino at Progressive Field, Dylan Cease against Kumar Rocker at Globe Life Field, Tyler Mahle against Peter Lambert at Daikin Park, Gerrit Cole against Eduardo Rodriguez at Chase Field, Bryan Woo at Coors Field with no Rockies starter listed
- MLB Stats API schedule endpoint for 2026-09-18 hydrated with probablePitcher, pulled September 18, 2026
- Royals 3.59 road and 4.20 overall runs per game, held to 3 or fewer in 48 of 78 road games; Braves 4.37 road and 4.60 overall; Pirates 4.61 and Astros 4.78 runs allowed per game; Guardians 24 home wins by two or more in 78 home games; Opponents held to 3 or fewer in 11 of 30 Skenes starts and to 4 or fewer in 17 of 26 Lambert starts
- Computed this session from the 2026 final scores pull, starts matched by listed probable pitcher
- Paul Skenes 3.78 ERA, 185 strikeouts in 162.0 innings; Peter Lambert 3.71 ERA, .649 OPS against; Mason Barnett 7.08 ERA; Dylan Cease 2.38 ERA, 1.89 in 13 road starts; Eduardo Rodriguez 2.62 ERA; Bryan Woo 5.23 road ERA
- MLB Stats API season and home and away pitching splits, 2026, pulled September 18, 2026
- Yankees 88 and 64 with a +136 run differential; Rockies 56 and 97
- MLB Stats API standings, 2026 regular season, pulled September 18, 2026
- Ticket prices: Guardians -1 -180 for 3 units, Blue Jays ML -132 for 1.5, Royals team total under 3.5 -125 for 1.5, Braves team total under 4.5 -139 for 1.5, Yankees ML -110 for 2, Mariners ML -181 for 2
- BetLegend card for September 18, 2026, as entered on the BetLegend Picks Tracker
Method: a road game counts once the visiting team has 20 road games behind it. Road average and season average are that team's runs per game before first pitch; runs allowed is the home team's runs allowed per game in all of its games before first pitch. Break even for a laying price is price divided by price plus 100; on the Guardians whole number line a one run win is a push and is left out. First pitches Friday, Pacific: 3:40 PM at PNC Park, 4:10 PM at Progressive Field, 5:05 PM at Globe Life Field, 5:10 PM at Daikin Park and Coors Field, 6:40 PM at Chase Field.