In 2026 A .100 To .199 Record Edge Won 50.6 Percent Of The Time Without An Ace On The Mound And 68.5 With One
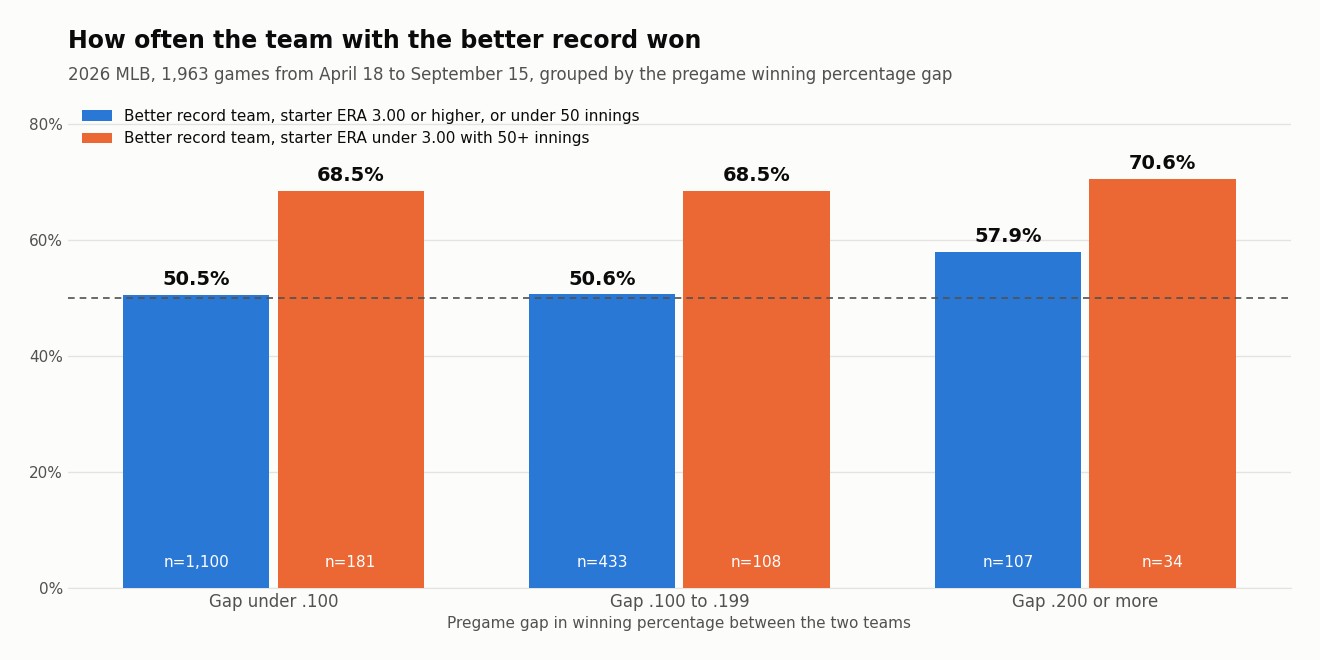
Here's a number that should bother anyone who prices a moneyline off the standings. In 2026, when one team's winning percentage was between .100 and .199 better than its opponent's going into the game, the better team won 54.2 percent of the time. That's 293 wins in 541 games. A .100 gap is roughly the difference between a 90 win team and a 75 win team, and it bought about four points over a coin flip.
Four points doesn't pay -162. It doesn't pay -124 either. So the question for Wednesday's prices isn't whether the favorite is the better team. It's what, beyond the standings, turns a better team into one that actually wins often enough. The answer in this season's data is the starting pitcher, and the effect is large enough that the record gap almost disappears next to it.
What we measured
1,963 completed regular season games from April 18 through September 15, 2026. Every game from Opening Day on was replayed in order, and each team's winning percentage was taken as it stood on the morning of the game, so no game sees its own result or anything after it. A game only counts once both teams had played at least 20, which is why the window opens on April 18. Two games without a listed starter were dropped.
The starter for each side comes from the MLB Stats API schedule record for that game. A starter counts as an ace here when his 2026 season ERA is under 3.00 with at least 50 innings and 8 starts. Everyone else, including good pitchers who haven't thrown enough yet, is in the other group.
The record gap on its own barely moves
| Pregame winning percentage gap | Games | Better record team won | Win rate |
|---|---|---|---|
| Under .100 | 1,281 | 679 | 53.0% |
| .100 to .199 | 541 | 293 | 54.2% |
| .200 or more | 141 | 86 | 61.0% |
The first two rows are close to identical. Doubling a record edge from something like .050 to something like .150 moved the win rate by a little over a point. Only at .200 and beyond does the better team start winning at a rate that looks like a real favorite, and even there it's 61 percent on 141 games.
Split it by the starter and the picture changes
| Gap | Better team's starter | Home games | Home win rate | Road games | Road win rate |
|---|---|---|---|---|---|
| Under .100 | ERA under 3.00 | 99 | 73.7% | 82 | 62.2% |
| Under .100 | Everyone else | 586 | 51.9% | 514 | 48.8% |
| .100 to .199 | ERA under 3.00 | 47 | 72.3% | 61 | 65.6% |
| .100 to .199 | Everyone else | 203 | 55.7% | 230 | 46.1% |
| .200 or more | ERA under 3.00 | 16 | 68.8% | 18 | 72.2% |
| .200 or more | Everyone else | 51 | 56.9% | 56 | 58.9% |
Read the second pair of rows slowly. A road team with a .100 to .199 record edge and an ordinary starter won 46.1 percent of 230 games. It lost more than it won. Put a pitcher with an ERA under 3.00 on the mound for that same kind of road team and it won 65.6 percent. The starter is worth nearly 20 points. The record gap, holding the starter fixed, is worth one or two.
The bottom two rows are small, 16 and 18 games, so we wouldn't lean on them. The top four rows have enough games to take seriously.
Break even for Wednesday's five prices
For a laying price the break even is the price divided by the price plus 100. For an under on a total or team total, the same formula applies to the under's price.
| Ticket | Price | Break even |
|---|---|---|
| Dodgers and Reds under 8.5 | -120 | 54.55% |
| Brewers ML at Pirates | -124 | 55.36% |
| Padres ML at Rockies | -162 | 61.83% |
| Rays ML vs Athletics | -173 | 63.37% |
| Athletics team total under 3.5 | -131 | 56.71% |
Measured at the three moneylines
Brewers ML at -124. Milwaukee is .623 and Pittsburgh is .497, a gap of .126, and the Brewers are on the road. Logan Henderson has a 2.34 ERA over 88.1 innings and 16 starts, so he qualifies. That bucket, road teams with a .100 to .199 edge and a sub 3.00 starter, won 65.6 percent of 61 games against a break even of 55.36. This is the cleanest fit on the card. It's also a reminder of how much the price depends on who's pitching: the same Brewers with an ordinary starter would sit in the 46.1 percent row.
Rays ML at -173. Tampa Bay is .607 and the Athletics are .404, a gap of .203, at home. Nick Martinez has a 2.92 ERA in 166.1 innings. The exact bucket is only 16 games at 68.8 percent, too thin to carry a number. Widen it to home teams with a gap of .150 or more and an ace on the mound and it's 25 wins in 37 games, 67.6 percent, about four points clear of 63.37. That's a pass on base rates, with the caveat that 37 games is not many. One more wrinkle belongs here: Martinez has a 3.92 ERA in 14 home starts and 1.99 in 14 road starts, so the season number flatters what he's done in this particular building.
Padres ML at -162. San Diego is .543 and Colorado is .371, a gap of .172, on the road. Robbie Ray's ERA is 3.57, so he's in the other group, and road teams in that bucket won 46.1 percent of 230 games. On the pitcher model this ticket is nowhere near 61.83. The one cut that rescues it is the park. Road teams with a record edge of .150 or more at Coors Field won 16 of 21, 76.2 percent, and every road team at Coors in the study window won 39 of 65, 60.0 percent. Twenty one games is a small sample, so the honest summary is that the Padres price is a bet on Colorado at altitude, not on the starter.
Measured at the two unders
Athletics team total under 3.5 at -131. Across the study window, road teams scored three runs or fewer 46.1 percent of the time. Against a home starter with an ERA under 3.00 it was 163 of 256, 63.7 percent. When that home team also had a record edge of .150 or more, it was 24 of 37, 64.9 percent. Both clear the 56.71 break even by around seven points. The A's on the road this season have been held to three or fewer in 40 of 76 games, 52.6 percent, and their .658 road OPS is where that comes from. The same home and road split on Martinez applies here too.
Dodgers and Reds under 8.5 at -120. This is the ticket the study likes least. All games finished with 8 runs or fewer 50.9 percent of the time. With the road team holding a .100 to .199 record edge, it was 52.2 percent of 293 games. Take every road team with an edge of .100 or more whose starter wasn't in the sub 3.00 group and it fell to 47.9 percent of 288. The Dodgers' edge tonight is .146. Blake Snell is in that group only because of the innings floor: his ERA is 1.91, but it's over 37.2 innings and 7 starts. So the study can't see the reason for this bet. Andrew Abbott, on the other side, has a 4.78 ERA in 30 starts. If you're on this under, you're betting that Snell's seven starts are real, and you should know the base rate doesn't back you.
Every ticket against its bucket
| Ticket | Break even | Bucket | Games | Bucket rate |
|---|---|---|---|---|
| Brewers ML, -124 | 55.36% | Road team, gap .100 to .199, starter ERA under 3.00 | 61 | 65.6% |
| Athletics team total under 3.5, -131 | 56.71% | Road team facing a home starter with ERA under 3.00, scored 3 or fewer | 256 | 63.7% |
| Rays ML, -173 | 63.37% | Home team, gap .150 or more, starter ERA under 3.00 | 37 | 67.6% |
| Padres ML, -162 | 61.83% | Road team, gap .100 to .199, other starter | 230 | 46.1% |
| Dodgers and Reds under 8.5, -120 | 54.55% | Road team edge .100 or more, other starter, 8 runs or fewer | 288 | 47.9% |
Three of the five clear their break even on base rates. The two that don't are the two where the card is leaning on something the buckets can't measure: altitude at Coors for the Padres and a short, very good Snell sample for the under.
What this study does not tell you
The records are clean, taken the morning of each game. The ERA groups aren't: they use each pitcher's season ERA as of Wednesday, which includes the games being measured, so the sub 3.00 group knows a little more than anyone knew in May. Pitchers traded midseason, like Ray, carry one combined ERA. The study doesn't see bullpens, lineups, weather or rest. And a moneyline bucket measures how often a team won, not whether the price was fair on the day. Base rates tell you which tickets need a reason. They don't supply the reason.
Fact manifest
- 2,271 completed 2026 regular season games from March 25 through September 15, with final scores and the listed starting pitcher for each side; 1,963 of them from April 18 on with both teams at 20 or more games and both starters listed
- MLB Stats API schedule endpoint, gameType R, three date ranges hydrated with probablePitcher, final scores only, pulled September 16, 2026
- Pregame winning percentage for each team in each game
- Computed this session by replaying the final scores above in date order, using records as of the start of each date
- Season ERA, innings and games started for 855 pitchers, used for the under 3.00 group with floors of 50 innings and 8 starts
- MLB Stats API season pitching stats, playerPool ALL, 2026, pulled September 16, 2026
- Win rate tables by gap and starter group, home and road cuts, Coors Field cuts, road teams scored 3 or fewer and games with 8 runs or fewer
- Computed this session from the pulls above
- Wednesday's probable starters: Blake Snell against Andrew Abbott, Logan Henderson against Jared Jones, Robbie Ray against Mason Adams, Brady Basso against Nick Martinez
- MLB Stats API schedule endpoint for 2026-09-16 hydrated with probablePitcher, pulled September 16, 2026
- Current records: Dodgers 92 and 59, Reds 70 and 81, Brewers 94 and 57, Pirates 75 and 76, Padres 82 and 69, Rockies 56 and 95, Rays 91 and 59, Athletics 61 and 90
- MLB Stats API standings, 2026 regular season, pulled September 16, 2026
- Logan Henderson 2.34 ERA in 88.1 innings over 16 starts; Nick Martinez 2.92 ERA in 166.1 innings, 3.92 at home and 1.99 on the road; Robbie Ray 3.57 ERA; Blake Snell 1.91 ERA in 37.2 innings over 7 starts; Andrew Abbott 4.78 ERA in 30 starts
- MLB Stats API season and home and away pitching splits for each pitcher, 2026, pulled September 16, 2026
- Athletics held to 3 or fewer in 40 of 76 road games, .658 road OPS
- Computed this session from the 2026 final scores pull; OPS from MLB Stats API team hitting splits
- Ticket prices: Dodgers and Reds under 8.5 -120, Brewers ML -124, Padres ML -162, Rays ML -173, Athletics team total under 3.5 -131
- BetLegend card for September 16, 2026, as entered on the BetLegend Picks Tracker
Method: a game counts for the better record team when that team's pregame winning percentage is at least as high as its opponent's, with the gap measured as the difference between the two. A win is the final score, extra innings included. Break even for a laying price is price divided by price plus 100. The under 3.00 group uses season ERA with at least 50 innings and 8 starts; every other starter is in the other group. First pitches on Wednesday run from 3:40 PM to 5:40 PM Pacific.