In 2026 A Team Five Or More Wins Hotter Over Its Last Ten Won 53.6 Percent, Less Than A Team One Win Hotter
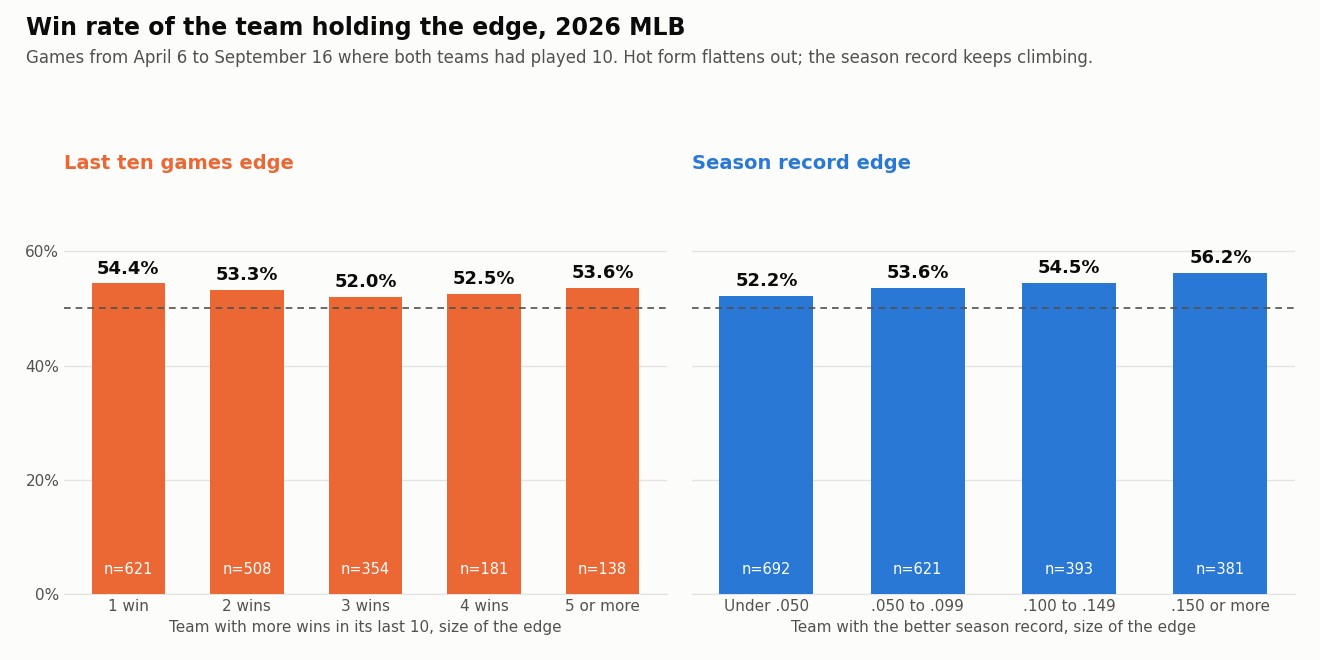
Every broadcast shows it and every preview leans on it: the last ten games. A team that's 9 and 1 sounds like a team you want, and a team that's 1 and 9 sounds like one you fade. So we went back through the 2026 season and asked a plain question. When one team's last ten was better than its opponent's, how often did it win the next game, and did a bigger edge in recent form buy a higher win rate?
It didn't. A team with just one more win over its last ten won 54.4 percent of 621 games. A team with five or more extra wins won 53.6 percent of 138. The hotter edge did slightly worse. Run the same test on the season record instead and the line climbs the way you'd expect, from 52.2 percent at the smallest gaps to 56.2 percent at .150 or more.
What we measured
2,134 completed regular season games from April 6 through September 16, 2026, every game in which both teams had already played at least ten. All 2,286 final scores from Opening Day on were replayed in date order, so each team's last ten and its season record are exactly what they were before first pitch. A game where both teams had the same last ten is left out of the form table, which is why that table covers 1,802 games.
Recent form on its own goes flat
| Edge in wins over the last 10 | Games | Hotter team won | Win rate |
|---|---|---|---|
| 1 win | 621 | 338 | 54.4% |
| 2 wins | 508 | 271 | 53.3% |
| 3 wins | 354 | 184 | 52.0% |
| 4 wins | 181 | 95 | 52.5% |
| 5 or more | 138 | 74 | 53.6% |
Nothing in that column moves in a straight line. A team that's gone 8 and 2 against an opponent at 3 and 7 won at about the same rate as a team at 6 and 4 against one at 5 and 5.
| Season record edge | Games | Better record won | Win rate |
|---|---|---|---|
| Under .050 | 692 | 361 | 52.2% |
| .050 to .099 | 621 | 333 | 53.6% |
| .100 to .149 | 393 | 214 | 54.5% |
| .150 or more | 381 | 214 | 56.2% |
When form and record disagree, form loses its voice
This is the cut that settles it. In 1,275 games the hotter team was also the team with the better season record, and it won 55.1 percent. In 497 games the hotter team had the worse season record. It won 247 of them, 49.7 percent. When the form edge was four wins or more and the record still pointed the other way, the hot team won 23 of 47. A streak didn't beat the season. It barely showed up.
Where a cold stretch does show up: runs
Winning is one thing. Scoring is another, and here the last ten tells you a little more. Across the study window a team scored four runs or fewer in 56.7 percent of its games. Split by how that team had done over its last ten:
| Team's own last 10 | Team games | Scored 4 or fewer | Average runs |
|---|---|---|---|
| 0 to 3 wins | 753 | 59.6% | 4.33 |
| 4 to 6 wins | 2,731 | 56.1% | 4.52 |
| 7 to 10 wins | 784 | 56.1% | 4.57 |
A cold team scored about a quarter of a run less and stayed at four or fewer three and a half points more often. Put that cold team at home against a visitor who had won seven or more of its last ten and it scored four or fewer in 60 of 96 games, 62.5 percent. It's a real lean, on a sample that's modest rather than large.
Measured at Thursday's two tickets
| Ticket | Price | Risk to win | Break even |
|---|---|---|---|
| Padres ML at Rockies | -195 | 3.90 to win 2 | 66.10% |
| White Sox team total under 4.5 vs Tigers | -145 | 2.175 to win 1.5 | 59.18% |
Padres ML at -195. This is the extreme version of the form story. San Diego is 9 and 1 over its last ten and Colorado is 1 and 9, an eight win gap, and the Padres took two of three at Coors to open this series. The study says that gap is close to noise. Road teams with a season record edge of .150 or more won 105 of 191, 55.0 percent. Add a form edge of five or more and it's 20 of 35, 57.1 percent. Neither is anywhere near 66.10. So if this ticket is right, the reason isn't the standings or the streak. It's the matchup on the mound. Michael King has a 3.03 ERA over 175 innings and allowed no earned runs in three of his last four starts. Tanner Gordon has a 5.55 ERA, a .884 OPS against, and a 7.47 ERA in six home starts at Coors. San Diego has won 10 of 12 against Colorado this season. That's the case, and it's a pitching case, not a form case.
White Sox team total under 4.5 at -145. Chicago is 3 and 7 over its last ten and Detroit is 7 and 3, which puts the White Sox exactly in the cold home team against a hot visitor row: 62.5 percent of 96 games at four runs or fewer, about three points over the 59.18 break even. The broader cold team row, 59.6 percent, sits right on it. Framber Valdez brings a 4.01 ERA but hasn't allowed an earned run in 13 innings over his last two starts. The pushback is real and worth saying out loud: the White Sox hit better at home, a .743 OPS, and they scored seven off Valdez in Chicago on May 30. They've scored four or fewer in 37 of 74 home games, exactly half.
What this study does not tell you
It doesn't see who pitched, who was hurt, or who rested. A 1 and 9 stretch can mean a bad team or a good team that ran into three aces, and this test treats them the same. The last ten is a crude window; a different cutoff could read differently, though we saw no sign of a clean trend at any gap. The scoring table counts runs in the game, extra innings included, which is how a full game team total grades. And none of this says whether Thursday's prices are fair. It says the streak shouldn't be the reason you pay them.
Fact manifest
- 2,286 completed 2026 regular season games from March 25 through September 16 with final scores; 2,134 of them from April 6 on with both teams at 10 or more games played
- MLB Stats API schedule endpoint, gameType R, three date ranges, final scores only, pulled September 17, 2026
- Each team's last ten record, last ten runs and season winning percentage before every game
- Computed this session by replaying the final scores above in date order
- Win rate tables by last ten edge and by season record edge, the agree and disagree cuts, and the scored 4 or fewer tables
- Computed this session from the pull above
- Thursday's probable starters: Michael King against Tanner Gordon at Coors Field, Framber Valdez against Erick Fedde at Rate Field
- MLB Stats API schedule endpoint for 2026-09-17 hydrated with probablePitcher, pulled September 17, 2026
- Records and last ten: Padres 83 and 69, 9 and 1; Rockies 56 and 96, 1 and 9; Tigers 72 and 80, 7 and 3; White Sox 77 and 75, 3 and 7
- MLB Stats API standings, 2026 regular season, pulled September 17, 2026
- Michael King 3.03 ERA in 175.0 innings and his game log; Tanner Gordon 5.55 ERA, .884 OPS against, 7.47 ERA in 6 home starts; Framber Valdez 4.01 ERA and his game log
- MLB Stats API season, game log and home and away pitching splits, 2026, pulled September 17, 2026
- Padres 10 and 2 against the Rockies; White Sox scored 4 or fewer in 37 of 74 home games and scored 7 against Detroit on May 30 with Valdez starting; White Sox .743 home OPS
- Computed this session from the 2026 final scores pull; OPS from MLB Stats API team hitting splits
- Ticket prices: Padres ML -195 for 2 units, White Sox team total under 4.5 -145 for 1.5 units
- BetLegend card for September 17, 2026, as entered on the BetLegend Picks Tracker
Method: the hotter team is the one with more wins in its previous ten games; the better record team is the one with the higher winning percentage before the game. A win is the final score, extra innings included. Break even for a laying price is price divided by price plus 100. First pitches on Thursday are 12:10 PM Pacific at Coors Field and 4:40 PM Pacific at Rate Field.