The Biggest Park Effect In Baseball Is Not Coors Field, And It Is Not Close
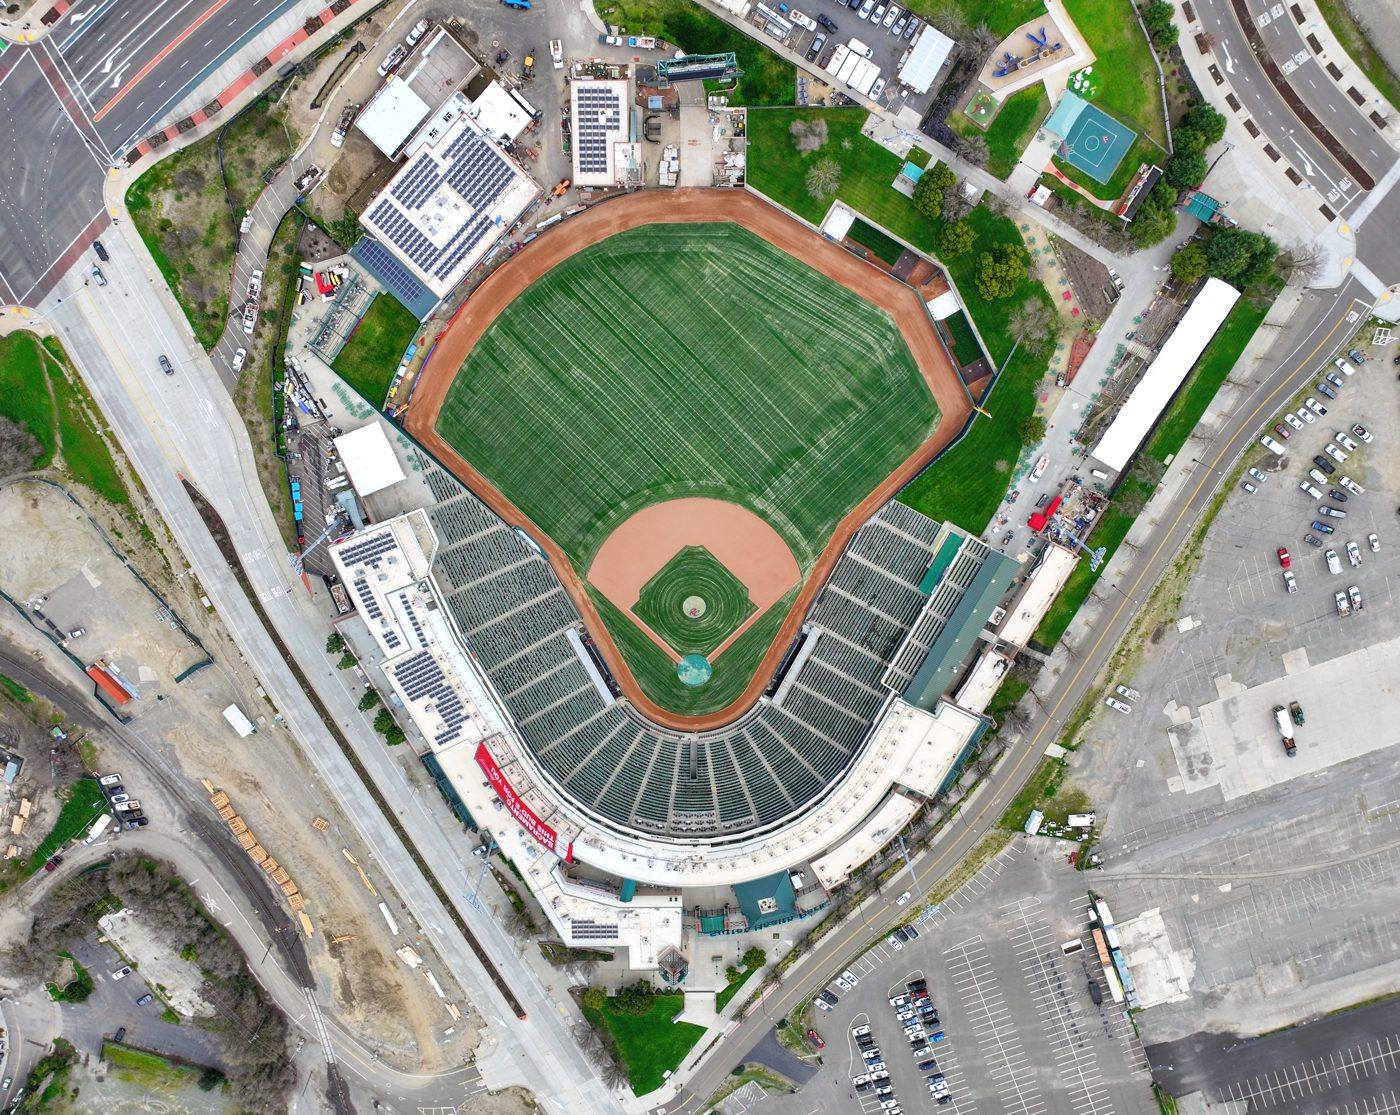
Ask a room full of bettors which ballpark moves a total the most and the answer arrives before the question finishes. Coors Field. It has been the answer for thirty years and it is a good answer, just not the right one for 2026.
There is a way to measure this that does not need altitude, dimensions, humidors or weather. Take one club. Look at what its games total at home. Look at what the same club's games total on the road. The roster barely changes between those two samples, so whatever is left is the building.
Every completed regular season game in 2026 through September 8, which is 2,181 games. For each club, the mean combined runs in its home games against the mean combined runs in its road games. Same lineup, same rotation, same bullpen, roughly seventy games on each side. The league mean is 8.95 combined runs and 39.61 percent of all games finish over 9.5.
| Club | Home combined | Road combined | Difference |
|---|---|---|---|
| Athletics | 11.80 | 8.39 | +3.42 |
| Colorado Rockies | 11.31 | 9.63 | +1.68 |
| Washington Nationals | 11.01 | 9.42 | +1.59 |
| Philadelphia Phillies | 9.45 | 7.92 | +1.54 |
| Pittsburgh Pirates | 10.21 | 8.75 | +1.45 |
| New York Yankees | 8.80 | 7.68 | +1.12 |
| St. Louis Cardinals | 8.33 | 9.93 | -1.60 |
| San Diego Padres | 7.61 | 9.11 | -1.50 |
| Los Angeles Angels | 7.91 | 9.30 | -1.39 |
| Seattle Mariners | 7.79 | 9.10 | -1.30 |
The Athletics home park adds 3.42 combined runs a game over the same roster on the road. Coors Field adds 1.68. The gap between first and second place is larger than the gap between second and twentieth.
Say that again slowly, because it is the whole study. The temporary ballpark in West Sacramento is doing twice what Coors Field does.
Combined runs is the honest measure but nobody bets a mean. Here is the same split at a live number, over 9.5, which is where a lot of these totals actually get posted.
| Club | Home over 9.5 | Road over 9.5 | Difference |
|---|---|---|---|
| Athletics | 63.38 percent | 36.00 percent | +27.38 |
| Washington Nationals | 57.53 percent | 36.49 percent | +21.05 |
| Colorado Rockies | 63.38 percent | 43.84 percent | +19.54 |
| Pittsburgh Pirates | 51.39 percent | 32.88 percent | +18.51 |
| Philadelphia Phillies | 46.58 percent | 30.56 percent | +16.02 |
| Cincinnati Reds | 48.65 percent | 36.62 percent | +12.03 |
| Baltimore Orioles | 39.19 percent | 51.39 percent | -12.20 |
| Seattle Mariners | 28.77 percent | 45.83 percent | -17.07 |
| San Diego Padres | 24.32 percent | 43.66 percent | -19.34 |
The Athletics and the Rockies land on the identical home figure, 63.38 percent. What separates them is the road half. Colorado still goes over 9.5 43.84 percent of the time away from Denver, because the Rockies carry a bad pitching staff everywhere they go. The Athletics fall to 36.00 percent, which is below the league rate.
That is the difference between a club that is always in high scoring games and a club that is only in high scoring games in one specific building.
The instinct is that a hitter's park means the home team hits. Split the runs by who scored them and that instinct is mostly wrong.
| Club | Home scored | Home allowed | Road scored | Road allowed |
|---|---|---|---|---|
| Athletics | 4.94 | 6.86 | 3.84 | 4.55 |
| Colorado Rockies | 5.10 | 6.21 | 4.38 | 5.25 |
| Washington Nationals | 5.38 | 5.63 | 4.88 | 4.54 |
The Athletics score 1.10 more runs a game at home. They allow 2.31 more. Two thirds of the entire park effect is on the pitching side, which means the useful read is not that the home lineup wakes up in West Sacramento. It is that anybody who pitches there gets hit, including the visitors' staff.
Colorado splits far more evenly, 0.72 on offense against 0.96 on defense. Washington is the strange one: the Nationals score more at home and allow more at home, but their road defense is the best version of them by a distance.
One. A park effect is a claim about both bullpens, not about one lineup. If the number moved because the home offense hits, a strong visiting starter neutralizes most of it. If it moved because everybody who throws there gets hit, the visiting starter is exposed too, and that is the Athletics case.
Two. Read the road half before you use the home half. Colorado at 63.38 percent home looks identical to the Athletics at 63.38 percent home. They are not the same bet, because the Rockies carry 43.84 percent of that with them and the Athletics carry 36.00.
Three. The bottom of the table is worth more than the top, because it is less priced. Everyone adjusts for Coors. Far fewer adjust for Petco, where San Diego games go over 9.5 only 24.32 percent of the time at home and 43.66 percent on the road, a 19.34 point swing in the other direction. That is the second largest absolute split in baseball and it never gets talked about.
Four. None of this survives being applied to a full season line. These are seventy game samples per side. A 27 point split has a real standard error attached and the responsible use is as a tiebreaker on a number already close to fair, not as a reason to lay a price.
Method: all 2,181 completed 2026 regular season games through September 8, from the MLB schedule endpoint, with final scores. Home and road samples run between 69 and 76 games per club. No park factor adjustment, no weather, no travel weighting; the point of the design is that the roster is held roughly constant and the building is the thing that changes. Over 9.5 is used because it is a common posted number in 2026, not because it is each club's median.