In 2026 Home Teams .050 To .099 Better In The Standings Won 54.8 Percent, Short Of The 60.16 Percent That -151 Needs
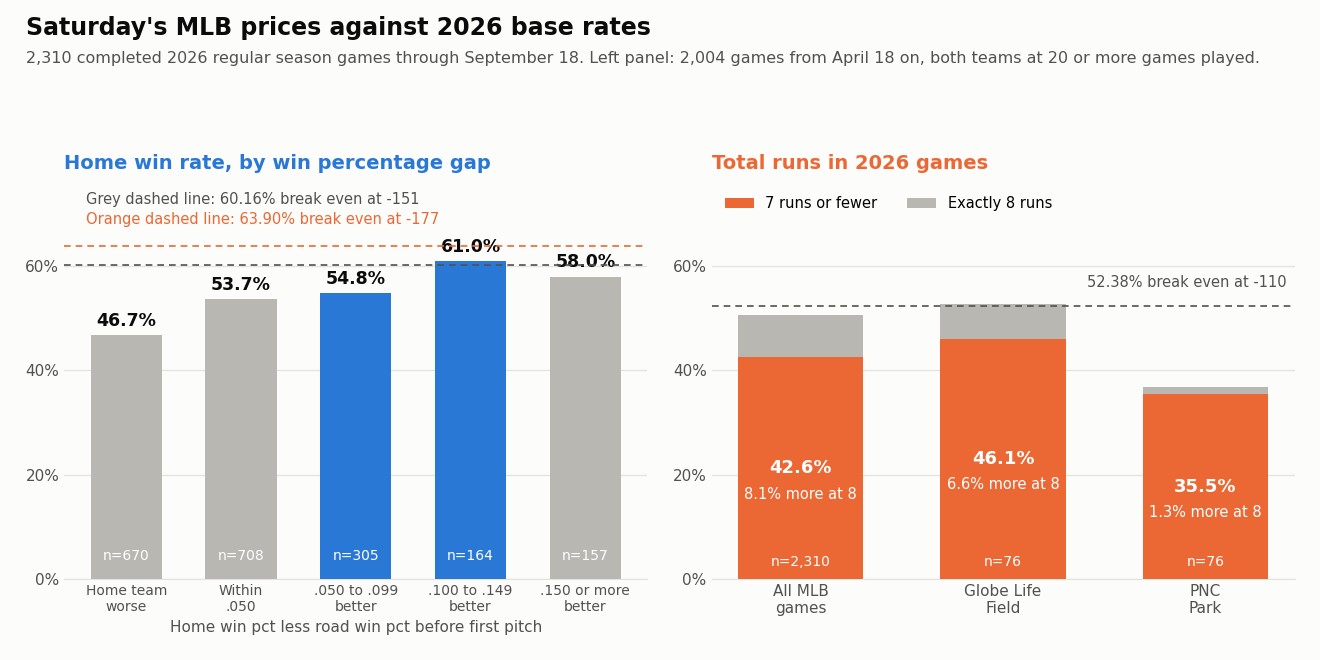
Three of Saturday's five plays are home favorites laying between -149 and -177, and the other two are unders. Before getting into pitchers, it's worth asking a plain question: how often has a 2026 home team in each of these spots actually won, and how often have games in these two parks actually stayed low? Those base rates are the floor every price has to be argued up from.
The short version is that none of the five clears its price on the base rate alone. That isn't a knock on the card. It just tells you where the case has to come from, which is the specific starters and the specific opponents, not the standings gap.
How the study was built
2,310 completed 2026 regular season games from March 25 through September 18, pulled from the MLB Stats API and replayed in date order so each team's record is exactly what it was before first pitch. For the win rate panel, both teams needed at least 20 games behind them, which starts the sample on April 18 and leaves 2,004 games. The gap is simply the home team's win percentage less the road team's.
| Home team's edge in win pct | Games | Home wins | Home win rate |
|---|---|---|---|
| Home team worse by .050 or more | 670 | 313 | 46.7% |
| Within .050 either way | 708 | 380 | 53.7% |
| .050 to .099 better | 305 | 167 | 54.8% |
| .100 to .149 better | 164 | 100 | 61.0% |
| .150 or more better | 157 | 91 | 58.0% |
The pattern climbs the way you'd expect until the top bucket, where it flattens out. The biggest mismatches on paper have won 58.0 percent at home, a hair less than the .100 to .149 group. That's 157 games, so don't read too much into the dip, but it does say the market isn't leaving easy money on the biggest standings gaps.
Rays -149 and Padres -151 sit in the same bucket
Tampa Bay is 93 and 60 and Boston is 84 and 70, a gap of .063. San Diego is 85 and 69 and Miami is 76 and 78, a gap of .058. Both land in the .050 to .099 row, where home teams have won 54.8 percent of 305 games. Break even at -149 is 59.84 percent and at -151 it's 60.16. On the standings alone, both prices are about five points too rich.
So the Rays case has to be about more than the record. They're 53 and 26 at Tropicana Field, which is the best part of their profile. The worry runs the other way too: Boston's run differential is +85, actually better than the Rays at +78, and the Red Sox are 46 and 33 on the road. Freddy Peralta starts for Tampa Bay with a 4.67 ERA and 23 home runs allowed in 158.0 innings. Boston hadn't listed a starter when the schedule was pulled Saturday morning.
The Padres look cleaner on the pitching side. Casey Mize carries a 3.69 ERA and a 1.14 WHIP over 124.1 innings, and San Diego is 47 and 29 at Petco Park. Miami is 31 and 45 on the road. Eury Pérez is a real arm, 155 strikeouts in 144.1 innings with a 3.99 ERA, but the home and road splits are the argument for paying more than the base rate.
Guardians -177: the best bucket, and still short
Cleveland is 79 and 75 and the Athletics are 61 and 93, a .117 gap. That's the best performing row in the table at 61.0 percent over 164 games, and it still falls under the 63.90 percent that -177 needs. The Guardians are only 39 and 40 at home, which doesn't help.
What does help is the opponent. The Athletics have been outscored by 216 runs and are 32 and 47 on the road. Jacob Lopez starts for them with a 5.02 ERA and a 1.48 WHIP. Tanner Bibee has a 4.16 ERA for Cleveland but has given up 28 home runs in 177.1 innings, so he isn't a lock to keep this quiet. This is a bet on the Athletics being worse than a .396 team usually is on the road, and their run differential says that's a fair argument.
The two unders, and a park that fights one of them
Across all 2,310 games, 42.6 percent finished with 7 runs or fewer and another 8.1 percent landed on exactly 8. At -110 an under 7.5 needs 52.38 percent, so the league as a whole doesn't get there either.
Blue Jays at Rangers, under 7.5 at -110. Globe Life Field has been one of the friendlier parks for this bet. 46.1 percent of its 76 games stayed at 7 or fewer and the average total there is 8.16, under the league's 8.98. Rangers games average 8.59 runs and Blue Jays games 8.33, both below the league figure. The pitching fits: Cal Quantrill has a 2.90 ERA and a 1.05 WHIP over 108.2 innings, and José Soriano is at 3.56 over 169.1. The one flag is Soriano's 72 walks.
Royals at Pirates, under 8 at -120. Here the park pushes back hard. PNC Park games have averaged 10.18 runs in 2026, and only 35.5 percent of its 76 games stayed at 7 or fewer. Exactly 8 has happened just once in those 76, so the push that usually softens an under 8 barely exists there. At -120 the bet needs 54.55 percent of decided games. The case is the starters: Noah Cameron has a 3.84 ERA and a 1.19 WHIP across 166.1 innings for Kansas City, and Bubba Chandler is at 4.28 for Pittsburgh, though his 75 walks in 147.1 innings are a reason for caution.
What the base rates say about the whole card
Five plays, 12.5 units to win against 18.31 at risk. The honest read is that every one of them is priced above what a generic team in the same spot has done this season. That doesn't make them bad bets. It means each one leans on something the standings don't capture, whether that's a home split, a bad road team, or a pair of starters who've kept runs off the board. The weakest fit with the data is the Royals and Pirates under, because PNC Park has played as a hitter's park all year.
Fact manifest
- 2,310 completed 2026 regular season games from March 25 through September 18 with final scores; 2,004 games from April 18 on with both teams at 20 or more games played
- MLB Stats API schedule endpoint, gameType R, March 20 to September 18, final scores only, pulled September 19, 2026
- Home win rates by win percentage gap; 42.6 percent of games at 7 runs or fewer and 8.1 percent at exactly 8; Globe Life Field 46.1 percent and 8.16 average; PNC Park 35.5 percent, 1 game of 76 at exactly 8, 10.18 average; Rangers games 8.59 and Blue Jays games 8.33 average total; team home and road records and run differentials
- Computed this session by replaying the final scores above in date order
- Records: Rays 93 and 60, Red Sox 84 and 70, Guardians 79 and 75, Athletics 61 and 93, Padres 85 and 69, Marlins 76 and 78
- MLB Stats API schedule endpoint for 2026-09-19 with leagueRecord, pulled September 19, 2026
- Probable starters: Freddy Peralta for Tampa Bay with no Boston starter listed; Jacob Lopez against Tanner Bibee; Noah Cameron against Bubba Chandler; José Soriano against Cal Quantrill; Eury Pérez against Casey Mize
- MLB Stats API schedule endpoint for 2026-09-19 hydrated with probablePitcher, pulled September 19, 2026
- Starter lines: Peralta 4.67 ERA, 23 home runs, 158.0 innings; Mize 3.69 ERA, 1.14 WHIP, 124.1 innings; Pérez 3.99 ERA, 155 strikeouts, 144.1 innings; Bibee 4.16 ERA, 28 home runs, 177.1 innings; Lopez 5.02 ERA, 1.48 WHIP; Quantrill 2.90 ERA, 1.05 WHIP, 108.2 innings; Soriano 3.56 ERA, 72 walks, 169.1 innings; Cameron 3.84 ERA, 1.19 WHIP, 166.1 innings; Chandler 4.28 ERA, 75 walks, 147.1 innings
- MLB Stats API people stats, season pitching, 2026, pulled September 19, 2026
- Ticket prices: Padres ML -151 for 3 units, Rays ML -149 for 3, Guardians ML -177 for 3, Blue Jays and Rangers under 7.5 -110 for 2, Royals and Pirates under 8 -120 for 1.5, all to win
- BetLegend card for September 19, 2026, as entered on the BetLegend Picks Tracker
Method: a team's win percentage is its record before first pitch, replayed from final scores. Break even for a laying price is the price divided by the price plus 100. For the under 8, break even is measured on decided games because an 8 run game is a push.