The Under Is A Defense Bet: An 888 Game Grid From The 2025 College Football Season
Every bettor knows the shortcut. Bad offense, take the under. It feels obvious, it is easy to say out loud on a podcast, and across a full season of real games it is close to worthless.
I pulled every completed FBS regular season game from 2025, 888 of them, computed what each team scored and what each team allowed across its own season, and then sorted every one of those games into a grid. The result is not subtle. The under does not live in the offense row. It lives in the defense column.
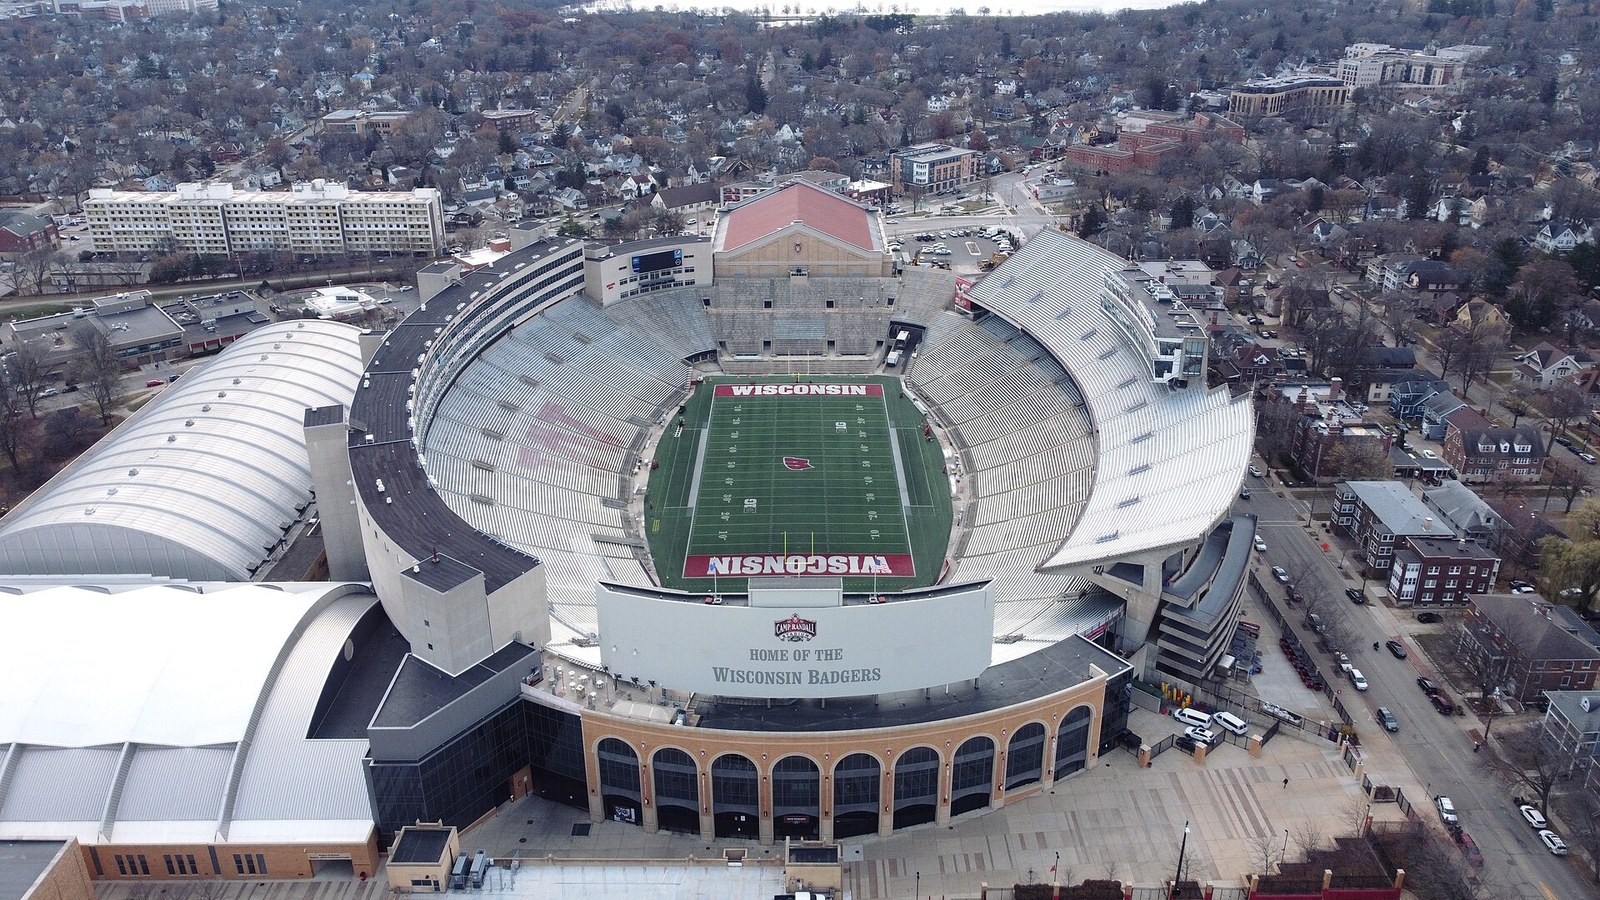
Camp Randall Stadium in Madison. Wisconsin scored 12.83 points a game in 2025 and still produced only two games that cleared 46 combined points, because the defense allowed 21.58. Photo: Lectrician2, CC BY-SA 4.0, via Wikimedia Commons.
All 888 games averaged 52.95 combined points and finished under 46 in 34.6 percent of them. That is the number every cut below has to beat to mean anything. A profile that produces a 35 percent under rate is not an angle, it is the league.
Rows are what a team scored per game across its own season. Columns are what the same team allowed. Every cell shows the number of team games, the mean combined total in those games, and the share that finished under 46.
| Scores per game | Allows under 20 | Allows 20 to 23.9 | Allows 24 to 29.9 | Allows 30 or more |
|---|---|---|---|---|
| Under 20 | no such team | 24 games 35.5 mean, 79% under | 72 games 45.2 mean, 50% under | 120 games 51.3 mean, 34% under |
| 20 to 27.9 | 61 games 41.2 mean, 70% under | 193 games 46.7 mean, 50% under | 193 games 51.2 mean, 38% under | 168 games 55.9 mean, 27% under |
| 28 to 34.9 | 148 games 48.6 mean, 45% under | 195 games 52.7 mean, 33% under | 183 games 57.7 mean, 24% under | 84 games 62.9 mean, 14% under |
| 35 and up | 75 games 55.2 mean, 32% under | 60 games 60.4 mean, 23% under | 62 games 65.4 mean, 8% under | 12 games 66.7 mean, 17% under |
Read the top row on its own. A team that scored under 20 points a game, which is as bad as an FBS offense gets, produced games that went under 46 79 percent of the time when its defense allowed 24 or fewer, 50 percent when its defense allowed 24 to 29.9, and 34 percent when its defense allowed 30 or more.
That is the whole finding in one line, and it is the opposite of the shortcut. The eighteen teams that scored under 20 a game went under 46 in 44.4 percent of their 216 games as a group, which sounds like an edge until you notice that all of it is concentrated in the 24 games where those teams could also defend.
The mechanism is not mysterious once you look at what a bad offense actually produces. It produces short possessions, punts from midfield, turnovers on its own side of the field, and a defense that has to keep coming back onto the grass with no rest. If that defense is ordinary, the opponent scores 38 and the game lands on 51 anyway.
The teams in the bottom left of the grid are the ones that break that chain. They give the ball back quickly, but their defense holds anyway, and the game turns into a punting contest that finishes 21-10. Twenty four team games in 2025 fit that description and they averaged 35.5 combined points, which is seventeen points below the league mean.
Look at the bottom row instead. Teams that scored 35 or more a game still went under 46 in 32 percent of their games when their own defense allowed under 20. Almost a third. Nearly the league baseline, for the most explosive offenses in the country.
Put them against a defense allowing 24 to 29.9 and the under rate collapses to 8 percent, on 62 games, the single most extreme cell in the grid. So a great offense is not an automatic over either. It is an over when the other side of its own ball is leaky, and it is a coin flip when it is not.
There is a second number worth holding onto next to that one. Offenses averaging 35 or more points a game played 37 games against top 25 scoring defenses in 2025 and averaged 26.57 points in them. Not 35. The best offenses in college football lose roughly a quarter of their output against real defenses, and the market is usually slower to price that than it is to price the offense itself.
Push the grid to its logical end and ask what happened when a 35 point offense met a team that scored under 20 and allowed 24 or fewer. That is the elite offense against the low scoring team that can still defend, and it happened four times in the entire 2025 season.
| Date | Game | Total | Elite offense scored |
|---|---|---|---|
| Sep 14, 2025 | Utah 31, Wyoming 6 | 37 | 31 |
| Oct 4, 2025 | UNLV 31, Wyoming 17 | 48 | 31 |
| Oct 25, 2025 | Oregon 21, Wisconsin 7 | 28 | 21 |
| Nov 15, 2025 | Indiana 31, Wisconsin 7 | 38 | 31 |
Three of the four went under 46, the mean was 37.75, and the elite offenses averaged 28.5 points rather than the 35 plus they carried into the game. Four games settles nothing on its own. What it does is agree with the 37 game sample above and with the grid, which is the most you can ask of a small cell.
One more cut from the same dataset, because it changes the number you should be starting from in early September. The 96 FBS games in week 1 of 2025 averaged 49.58 combined points and went under 46 in 38.5 percent. The remaining 792 games averaged 53.36 and went under in 34.1 percent.
Just under four points a game, and the reasons are the ordinary ones. New starters, new coordinators, timing that has not arrived yet, and second half play calling that hides everything worth hiding because the film gets studied for a month. If your model is built on last season, week 1 needs a few points shaved off before you compare it to the number.
Two of the four games in that narrow cell were Wisconsin, and that is not a coincidence. The Badgers scored 12.83 points a game in 2025, 135th of 136 FBS teams, while allowing 21.58, which is 39th. That is exactly the profile in the top left of the grid: an offense that cannot function, attached to a defense that can.
Their season proves the point better than the grid does. Ten of Wisconsin's twelve games finished under 46. The highest combined total in any of them was 52, and it took Alabama scoring 38 to get there. Against Power Four opposition the Badgers scored 95 points in ten games, 9.5 a game, with two shutouts.
They open 2026 against Notre Dame at Lambeau Field, and Notre Dame is the bottom row of the grid: 42.0 points a game in 2025, fourth in the country, attached to a defense that allowed 17.58, which is 13th. Elite offense, elite defense. The grid says that combination is not an automatic over, and the market has the total at 46.5.
One. Never bet an under on a bad offense without first checking what its defense allows. A sub 20 offense with a 30 plus defense produced the league average under rate in 2025, which means the angle you thought you had was a coin flip with juice attached.
Two. The defense column moves the number more reliably than the offense row does. Going from a defense allowing under 20 to one allowing 30 or more inside a single offensive tier swings the under rate by 40 points or more in every row.
Three. A 35 point offense is not a licence to take the over. Those teams went under 46 in a third of their games when their own defense was elite, and they lost a quarter of their scoring against top 25 defenses. Price the matchup, not the reputation.