Which Point Is Worth Buying: An 883 Game Key Number Grid Sorted By What The Spread Was
Everybody can recite the key numbers. Three, seven, ten, fourteen. It is the first thing anybody learns about football betting and it is repeated as if it were a law of physics that applies identically to every game on the board.
It is not. A key number is a property of a price range, not of the sport. The 7 point margin that makes a half point precious in a field goal game is close to worthless when a team is laying four touchdowns, and if you buy points off a generic chart you are systematically overpaying in exactly the spots where the chart is wrong.
So I built the grid the right way round. Every completed FBS regular season game from 2025 that carried a recorded closing spread, 883 games, sorted first by what the market thought the game was, and only then by where it actually finished.
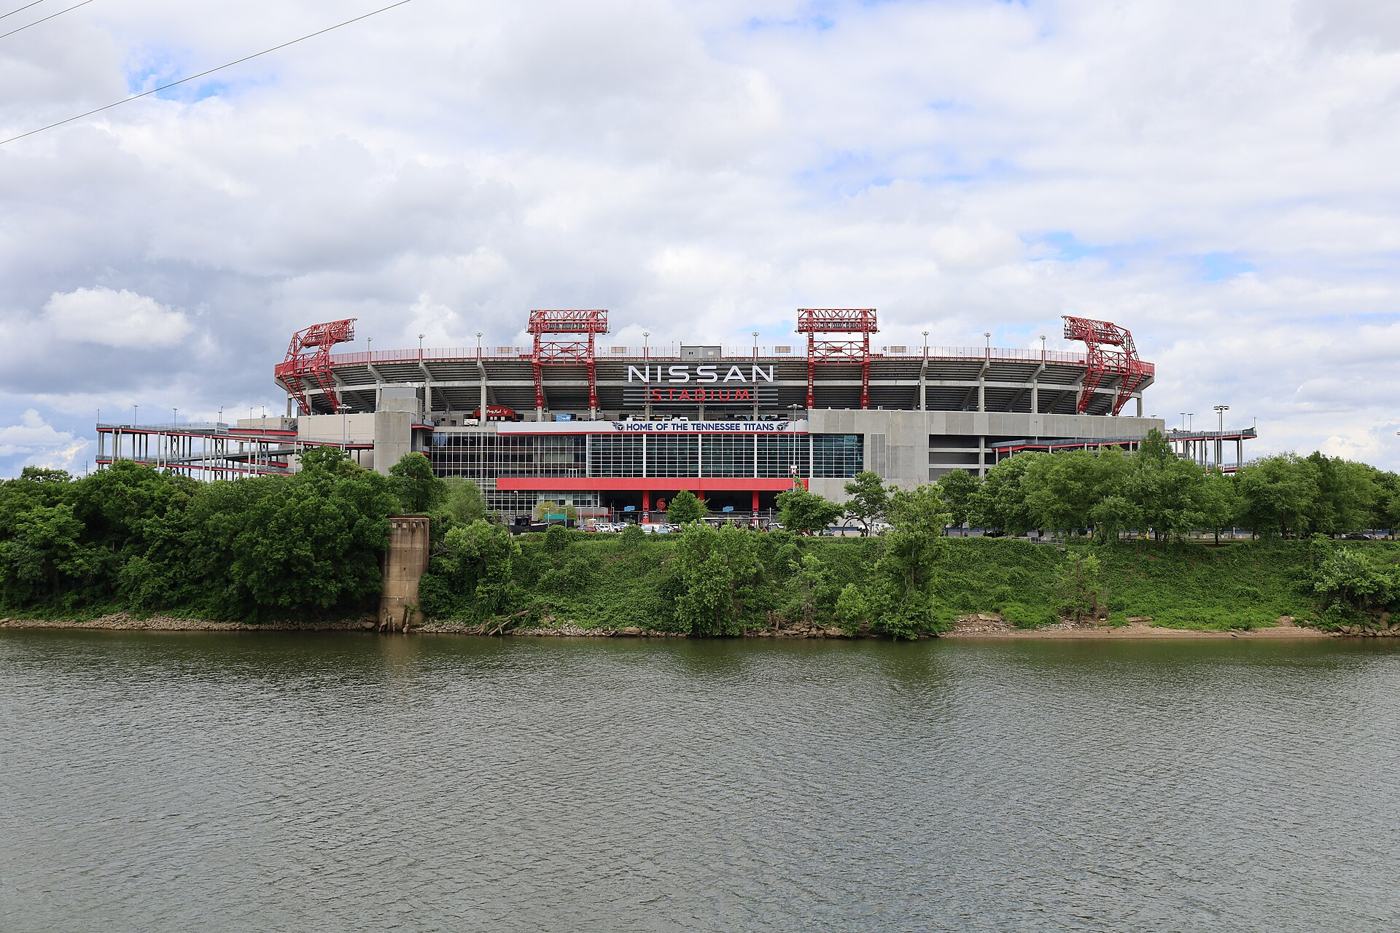
Nissan Stadium in Nashville, where No. 24 Louisville and No. 9 Ole Miss give the grid a live test at a 6.5 point spread. Photo: Antony-22, CC BY-SA 4.0, via Wikimedia Commons.
Rows are the closing spread band. Columns are the share of games in that band that finished on exactly that margin.
| Closing spread | Games | Margin 1 | Margin 3 | Margin 6 | Margin 7 | Margin 10 | Margin 14 |
|---|---|---|---|---|---|---|---|
| 1 to 3 | 135 | 2.22% | 18.52% | 7.41% | 11.85% | 5.19% | 5.19% |
| 3.5 to 6.5 | 216 | 5.09% | 12.04% | 6.48% | 10.65% | 4.63% | 2.78% |
| 7 to 10 | 107 | 7.48% | 11.21% | 0.00% | 11.21% | 6.54% | 0.93% |
| 10.5 to 14 | 109 | 3.67% | 17.43% | 0.00% | 6.42% | 3.67% | 2.75% |
| 14.5 to 21 | 118 | 4.24% | 5.93% | 2.54% | 4.24% | 3.39% | 6.78% |
| 21.5 and up | 198 | 0.00% | 2.02% | 0.00% | 1.52% | 0.51% | 2.02% |
Read down the margin 7 column. It holds up beautifully through the first three bands, collapses by more than half in the 10.5 to 14 band, and is effectively gone by the time the number gets big. The margin 3 column does something similar but survives longer, which is why 3 is genuinely the king number and 7 is the conditional one.
Note the two zeroes in the margin 6 column. In the 7 to 10 and 10.5 to 14 bands, across 216 games between them, not one game finished with a 6 point margin. That is small sample noise and I am not going to pretend otherwise, but it is a useful reminder that the tail of a key number chart is thinner than people treat it.
The only question that matters when you are staring at an alternate line is simple: what is the most I can pay for this point before it stops being worth it?
The arithmetic is direct. Buying a point that converts a specific margin from a loss into a win adds that margin's share of games to your win rate. If you can take the base number at even money, break even is 50 percent, so the maximum price you can pay is whatever price has a break even of 50 plus that share.
Here is that calculation for the 3.5 to 6.5 band, the 216 game row, which is where most short favourites live.
| Buying through | Games in the band | Share added | Most you should pay |
|---|---|---|---|
| 3 | 26 | 12.04% | -163 |
| 7 | 23 | 10.65% | -154 |
| 6 | 14 | 6.48% | -130 |
| 1 | 11 | 5.09% | -123 |
| 10 | 10 | 4.63% | -120 |
| 14 | 6 | 2.78% | -112 |
That is the whole discipline in one table. Anything at or under those prices is a buy in that band. Anything over them is the book selling you a comfort blanket.
And run the same sum for the 21.5 and up band and buying through 7 is worth -106. Six cents. If you have ever paid 20 cents to move a 24 point dog from +24.5 to +25.5, you were not buying protection, you were paying rent.
Louisville and Ole Miss at Nissan Stadium in Nashville is on the board tonight at Ole Miss -6.5, which drops it straight into the 3.5 to 6.5 row. So the grid makes a falsifiable claim about it before kickoff rather than after.
The row says a 7 point margin is worth 10.65 percent here, and that the ceiling on buying through it off an even money base is -154. The alternate ladder on this game prices Louisville +7.5 at -145. By this study that point is nine cents underpriced, and by the same study the identical purchase would be indefensible if Ole Miss were laying 22 instead of 6.5.
Whether the ticket wins tells you almost nothing, which is the uncomfortable part of key number work. One game cannot validate a 216 game row. What the row is claiming is that if you take this purchase every time the price band allows it, the 7 point margins arrive often enough to cover the juice, and the only way to find out is to keep taking it and keep the receipts. The specific pick, the price and the unit size are logged on the BetLegend record.
Three honest limits, because a grid with no caveats is a sales pitch.
One season is one season. 883 games is a real sample for the aggregate but the individual cells get thin fast. The 21.5 and up row has 198 games and three of its six cells are under one percent, which means single games move those numbers by half a point.
Closing spreads, not the number you got. Every band here is built on the closing line. If you bet into a number that later moves a full point, your game belongs in a different row than the one it was sorted into.
The base price assumption matters. Every maximum price in the second table assumes you could have had the base number at even money. If the base number costs -110 rather than even money, every maximum in that column loosens, because the alternative you are giving up is itself a worse price. Buying through 7 goes from -154 to -170, and through 3 from -163 to -181. Work out which base you are actually comparing against before you use the column.
None of that changes the shape of the finding. Key numbers are conditional on price, the conditioning is strong, and any point buying rule that ignores what the spread is will overpay on big numbers and underpay on small ones for as long as you run it.