Half Of The 3 Point Margins Are Already Yours: The Directional Correction Nobody Applies When Buying Through 3
Every key number chart in this sport reports margins as absolute values. A game finished by 3, by 7, by 10. That is the correct way to describe a season and it is the wrong way to price a point, because a bet has a direction and a margin chart does not.
The gap between those two things is larger than almost anybody accounts for, and it is at its largest on the exact purchase that gets made the most: a short underdog buying from +2.5 through 3 to +3.5.
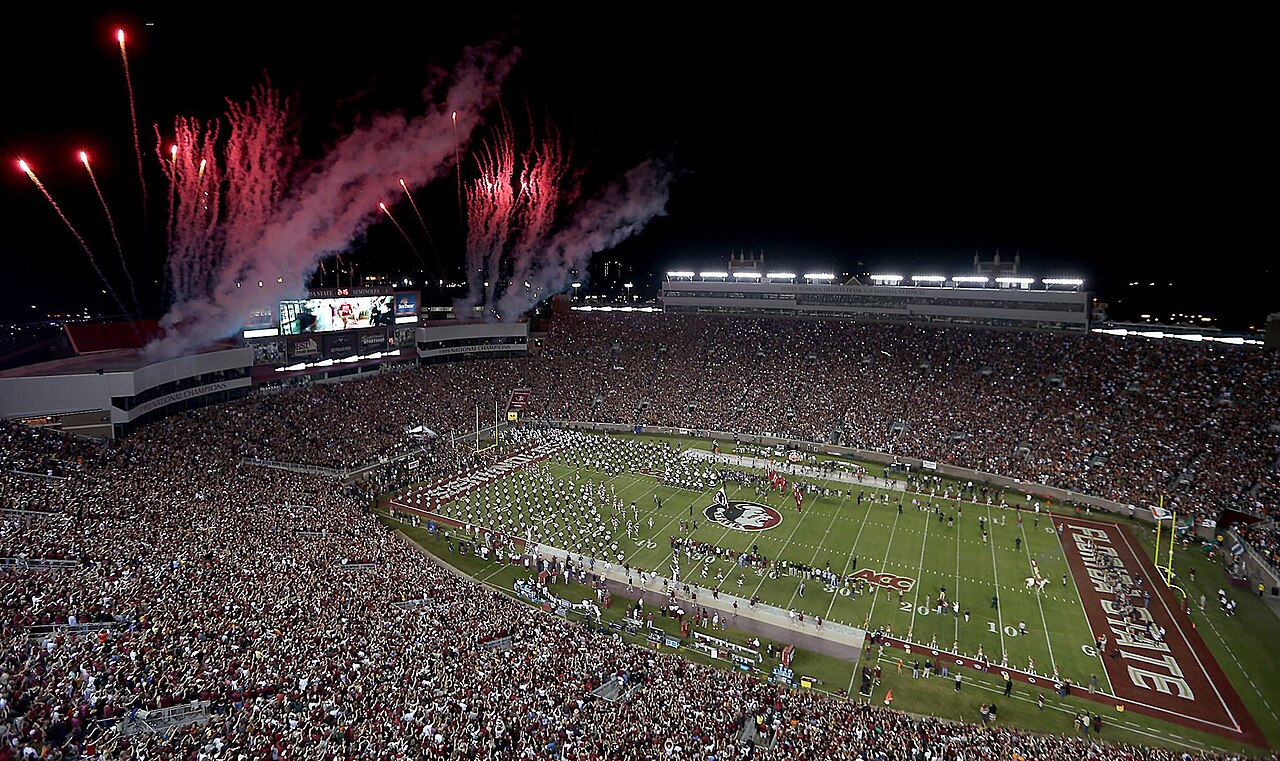
Doak Campbell Stadium in Tallahassee. SMU closed a 2.5 point favourite here on Labor Day, which drops this game into the 135 game band the study is built on. Photo: SeminoleNation, CC BY-SA 4.0, via Wikimedia Commons.
Every completed FBS regular season game from 2025 that carried a recorded closing spread, 883 games. Sorted first by what the market thought the game was, and only afterwards by how it finished. This piece looks only at the tightest band, the games that closed with a spread of 1 to 3, of which there were 135.
Here is the 1 to 3 band, with the 3 point margin broken into the two things it actually is.
| Outcome | Games | Share of 135 |
|---|---|---|
| Margin of exactly 3, either direction | 25 | 18.52% |
| Underdog won by exactly 3 | 15 | 11.11% |
| Favourite won by exactly 3 | 10 | 7.41% |
| Margin of exactly 2 | 2 | 1.48% |
| Margin of exactly 1 | 3 | 2.22% |
The split is not even, and it does not favour the person buying the point. In this band the underdog won by exactly 3 more often than the favourite did, 15 times against 10. Short dogs win these games outright a lot, and when they win them narrowly they win them by a field goal.
Which is exactly the problem. A bettor sitting on +2.5 has already won all fifteen of those underdog wins. Buying up to +3.5 does nothing for them. The purchase converts one thing and one thing only: the ten games where the favourite won by exactly 3.
Turn both numbers into a ceiling and put them next to each other. The method is the one we published in the 883 game grid: the maximum price you can pay for a point is whatever price has a break even equal to your current break even plus the share of games the point adds.
| Version | Share added | Break even after | Max price, base at -110 |
|---|---|---|---|
| Absolute margin, the number usually quoted | 18.52% | 70.90% | -244 |
| Directional, dog buying through 3 | 7.41% | 59.79% | -148 |
| Directional, favourite buying through 3 | 11.11% | 63.49% | -174 |
Ninety six cents. That is the size of the error between the number people quote and the number that applies to a dog buying through 3 off a -110 base. A bettor working from the absolute figure will happily pay -200 for a point that is worth -148, and will feel disciplined doing it because they used a table.
Note the third row too, because the asymmetry runs the other way for the other side. A short favourite buying from -3.5 down to -2.5 is buying the underdog wins by 3, and in this band those were the more common outcome. Same point, same game, two different fair prices, and the direction decides which.
It is tempting to call 15 against 10 noise on a 135 game band, and the honest answer is that a single cell of ten games cannot carry much weight on its own. Two things argue it is at least partly real.
The first is that short favourites in college football are favourites by a small amount for a reason, and the games are frequently decided by whichever side gets the ball last. Home field is worth roughly a field goal in most models, so a 2.5 point road favourite is a team the market thinks is better by around six on neutral ground playing somewhere that gives three back. That is a recipe for a game decided inside one possession in either direction rather than one that tilts toward the favourite.
The second is the shape of the whole season. Across all 883 games in the sample the favourite won by exactly 3 in 6.12 percent of them. Notice that this is lower than the 7.41 percent in the tight band, which is what you would expect: the closer the game is priced, the more likely any specific small margin becomes. The band figure is not an outlier against the season, it is the same distribution concentrated.
SMU closed a short favourite at Florida State on Labor Day night, which puts the game in this band. Consensus was Florida State +2.5 at -110, and the alternate ladder posted +3.5 at -136.
By the absolute number that looks like a steal. By the directional number it is a buy by about thirteen cents, which is a much less exciting sentence and a much more useful one. Same purchase, same price, and the two methods disagree about how good it is by a factor of seven.
Writing that down before kickoff is the point of the exercise. Whether the ticket wins tells you nothing at all about whether -136 was the right price. Ten games out of 135 is a thin cell and one result does not move it.
One season. 883 games is a real aggregate sample and the individual directional cells are not. Ten games is ten games and should be treated as a first estimate, not a settled constant.
Closing spreads only. Every band here is built on the number the game closed at. If you bet into 1.5 and it closes at 3, your game is not in the row you thought it was in.
The base price sets everything. Every maximum above assumes the alternative you gave up was the base number at -110. If your book posts the base at -105 or at even money, every ceiling in that column tightens, and the directional correction bites harder rather than less.
None of that changes the shape of the finding. A margin chart tells you how often a number lands. It does not tell you who it lands on, and if you are buying a point, who it lands on is the only thing you are paying for.