Beating An FCS Team By 42 Is Worth Something. Beating One By 20 Is Worth Less Than Nothing
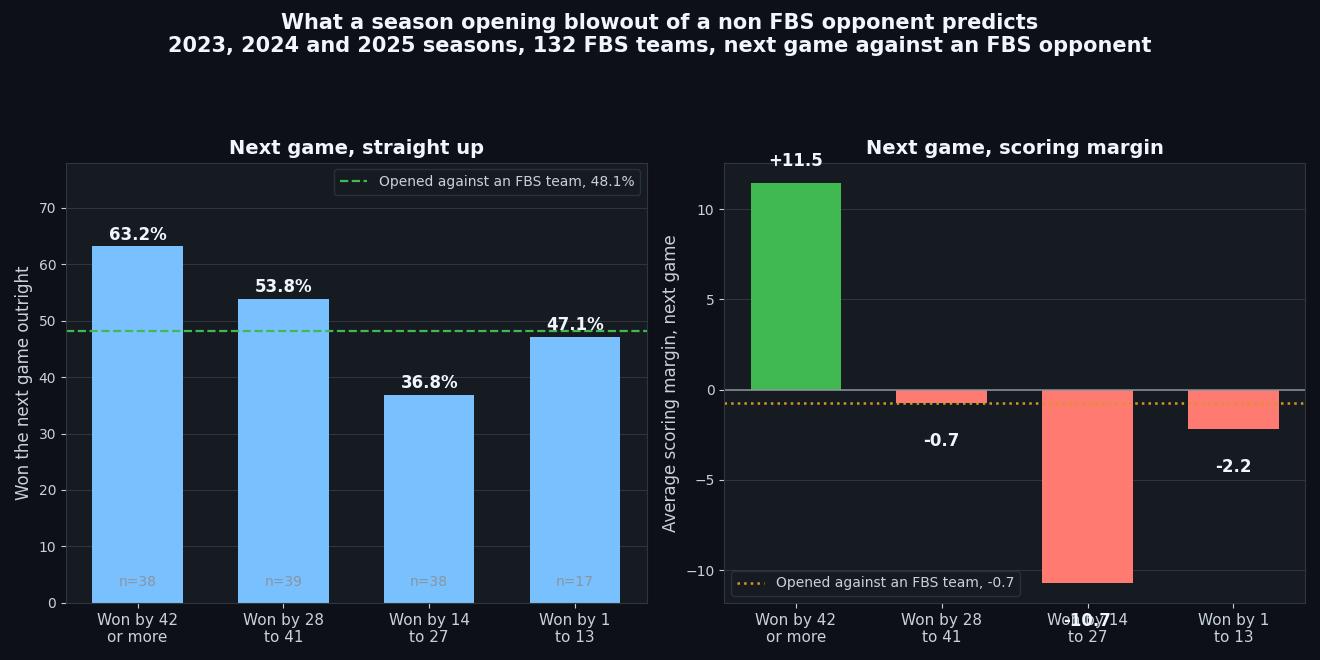
On the second Saturday of September, half the college football board is priced off one game that told you almost nothing. A Power Four team opens against an FCS program, wins by six touchdowns, and the number for week two gets built on top of that result. Everyone knows the opener was a scrimmage. The number gets built anyway, because there is nothing else to build it from.
So we asked a narrow question with a clean answer: does the size of a cupcake win predict anything at all?
What we measured
The 2023, 2024 and 2025 seasons. Every FBS team whose first game of the year was a win over an opponent outside FBS, 132 of them, matched against what that team did in its next game against an FBS opponent. No spreads, no totals, no efficiency ratings. Just the margin in game one and the result in game two.
As a control, we ran the same thing on the 156 FBS teams whose opener was against another FBS team.
The answer is yes, and then the answer is no
| Season opening win over a non FBS opponent | Teams | Won next game | Average margin, next game |
|---|---|---|---|
| Won by 42 or more | 38 | 63.2% | +11.5 |
| Won by 28 to 41 | 39 | 53.8% | -0.7 |
| Won by 14 to 27 | 38 | 36.8% | -10.7 |
| Won by 1 to 13 | 17 | 47.1% | -2.2 |
| All 132 | 132 | 50.8% | -0.3 |
| Control: opened against an FBS team | 156 | 48.1% | -0.7 |
The top row and the third row are 26 points apart in win rate and 22 points apart in scoring margin, off nothing but how many points they hung on a team they were never going to lose to. The correlation between the opening margin and the next game margin is 0.31 across all 132. That is not a strong relationship. It is also not zero, and it is measured on the exact piece of information most people throw away.
The useful version of this is not "blowouts are good." It is the middle of the table. A Power Four team that beat an FCS program by 20 went 36.8 percent and lost its next game by an average of 10.7 points. It is the worst bucket on the board, worse than the teams who opened against real opponents and lost, worse than the teams who barely got past a cupcake. A three touchdown win over an FCS team is the shape of a team that is not ready, and the market grades it as a win.
The one place this breaks
The bottom row does not follow the pattern. Teams that squeaked past a non FBS opponent by 13 or fewer went 47.1 percent, better than the 14 to 27 bucket above them. That bucket is 17 teams. Seventeen is not enough to draw a line through, and anyone presenting this as a clean monotonic gradient is overselling it. Three of the four buckets line up. The smallest one does not.
The honest summary is that the top of the range and the middle of the range separate, and the bottom of the range is too thin to call.
How it reads on Saturday September 12
Four teams on today's board opened exactly this way, and the study sorts them differently than the scoreboard does.
| Team | Opener | Opponent | Bucket |
|---|---|---|---|
| UCF Knights | Won 73-6 | Bethune Cookman (FCS) | 42 or more, 63.2% |
| BYU Cougars | Won 63-7 | Utah Tech (FCS) | 42 or more, 63.2% |
| Arizona Wildcats | Won 35-7 | Northern Arizona (FCS) | 28 to 41, 53.8% |
| Pittsburgh Panthers | Won 59-14 | Miami of Ohio (FBS) | Control group, 48.1% |
UCF is in the best bucket in the study and is a touchdown underdog at Pittsburgh. Pittsburgh's 59 point opener was against an FBS opponent, which puts the Panthers in the 48.1 percent control group rather than in any blowout tier. The study does not say UCF wins. It says the market's read of those two openers is doing more work than the openers can support.
Arizona and BYU sit one bucket apart, BYU on the strong side of it, and Arizona is getting seven in Provo. That is the number the study is least uncomfortable with, because the gap between a 56 point cupcake win and a 28 point cupcake win is real but it is worth about a touchdown of next game margin, which is roughly what the market is charging.
What this is not
This is a straight up and margin study, not an against the spread study. We do not have opening lines attached to these 288 games, so nothing here says a bucket beat a number. It says how teams performed, and a bettor still has to pay the price on the board.
It is also three seasons and 132 teams in the treatment group. That is enough to separate a 63 percent bucket from a 37 percent bucket and it is nowhere near enough to price a single game off.
Method: ESPN college football scoreboard feeds for the opening four weeks of the 2023, 2024 and 2025 seasons, completed games only. The FBS set was built by taking every team that appeared at least three times across eight mid season Saturdays of the 2025 schedule, which yields 137 clubs, and any opponent outside that set is treated as non FBS. A team's opener is its first completed game in the feed and its next game is the second, and a team is only counted when that second game is against an FBS opponent. Margins are final scores. Overtime results count as they finished. No line data is used anywhere in this study.