Garbage Time Is A Myth: Big Fourth Quarter Leads Got Bigger In 2025
Everybody who has ever laid three touchdowns knows the feeling. The favourite is up 31 to 7 going into the fourth, the starters come out, and a beaten team walks 80 yards against a second string secondary that has not taken a live rep since August. The spread dies on a touchdown that changed nothing about the game.
That fear is the single most common argument against laying a big number in college football, and across the 2025 FBS regular season it is mostly wrong. Teams that led by 21 or more after three quarters did not bleed the lead. They extended it, by an average of 2.41 points.
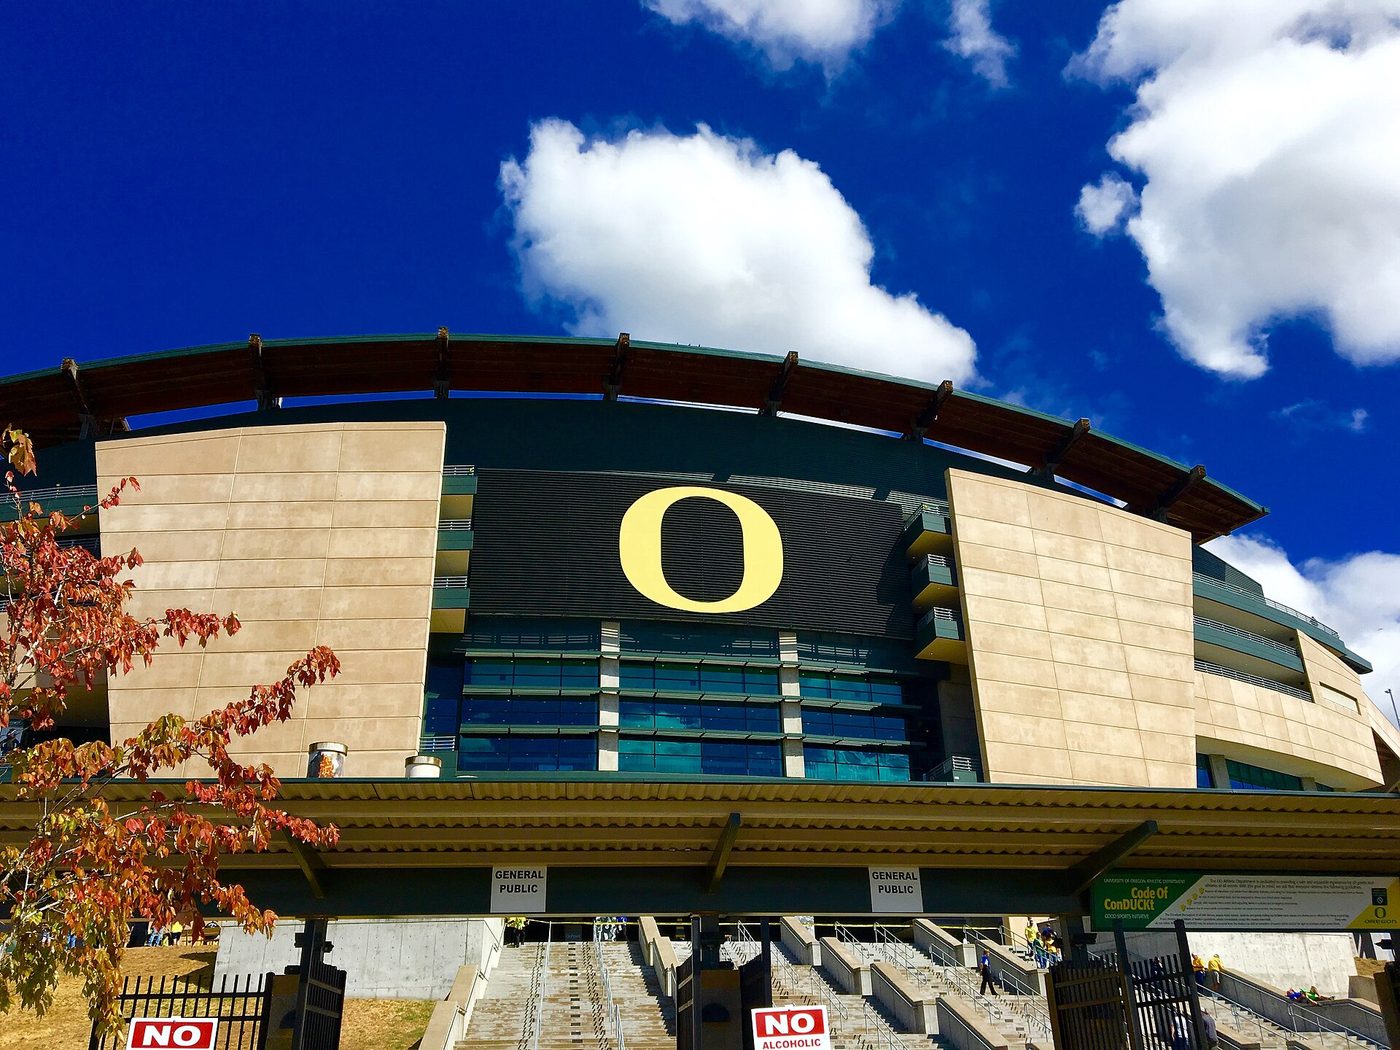
Autzen Stadium, Eugene. The fear when you lay three touchdowns is the fourth quarter. The 2025 season says the fourth quarter is usually where the lead grows. Photo: Kingofthedead, CC BY-SA 4.0, via Wikimedia Commons.
Take every 2025 FBS regular season game with a full four quarter line score, 888 of them, and split each one into two team games so both the leader and the trailer are counted. That gives 1,776 observations. Now isolate the ones where a team was up 21 or more entering the fourth quarter: 282 team games.
| What happened in the fourth quarter | Share of the 282 |
|---|---|
| Outscored the opponent in the fourth | 69.5% |
| Was outscored in the fourth | 30.5% |
| Gave back 7 or more of the lead | 18.8% |
| Gave back 14 or more of the lead | 3.2% |
| Mean fourth quarter point differential | +2.41 |
The median fourth quarter differential for a team up three touchdowns was +3.0. Not zero, not negative. Positive. The garbage time story imagines a fourth quarter that flows one direction, and what the season actually produced was a fourth quarter that mostly flowed the same direction as the first three.
The two touchdown giveback, the scenario that turns a 24 point win into a 10 point win and kills a large spread outright, happened in 9 of 282 team games. That is 3.2 percent, and it is the honest size of the thing everybody is afraid of.
Reframe it as a question a bettor can use. If a favourite is laying 20.5, what three quarter lead does it need before the cover is effectively decided?
| Lead after 3 quarters | Team games | Won by 20.5 or more | Won by 24.5 or more |
|---|---|---|---|
| 7 or more | 658 | 51.8% | 40.9% |
| 13 or more | 464 | 69.6% | 56.0% |
| 17 or more | 370 | 77.8% | 66.5% |
| 21 or more | 282 | 88.7% | 78.4% |
| 25 or more | 213 | 95.3% | 89.2% |
| 29 or more | 152 | 98.0% | 95.4% |
| 33 or more | 110 | 100% | 99.1% |
Three touchdowns up after three quarters was worth an 88.7 percent chance of winning by more than 20.5, and a 78.4 percent chance of winning by more than 24.5. A 25 point lead after three took the bigger number to 89.2 percent. From 33 points up, across 110 team games, the 20.5 cover never once failed.
The practical version of that table is short. If you are laying 20.5, you are not waiting for the fourth quarter to be kind to you. You are waiting to be up 21 at the end of the third, and if you are, the ticket is roughly a 9 to 1 favourite from there.
The other half of this is where large final margins come from, and the answer is not the fourth quarter. Of the 349 games that finished with a margin of 21 or more in 2025, 91.7 percent were already 14 or more apart after three quarters and 71.6 percent were already 21 or more apart.
Large spreads are decided in the first three quarters and confirmed in the fourth. The number of games where a modest three quarter lead exploded into a blowout in the last fifteen minutes is small, and the number where a blowout collapsed into a close game is smaller. A big spread is a bet on the first 45 minutes, not the last 15.
Week one is the week where the garbage time worry gets loudest, on the theory that nobody knows anything yet and games are ragged. The 2025 opening week says the opposite in both directions.
| Measure | Week 1 | Weeks 2 to 16 |
|---|---|---|
| Games finishing 21 or more apart | 50.0% (96 games) | 38.0% (792 games) |
| Mean fourth quarter differential when up 21 or more | +5.70 | +2.41 season wide |
| Up 21 after three quarters, won by 20.5 or more | 90.7% (43 team games) | 88.7% season wide |
Half of the 2025 openers ended with a three touchdown margin, against 38.0 percent for the rest of the season. And in the openers specifically, teams already up three touchdowns pushed the fourth quarter differential to +5.70, more than double the season figure. Opening week does not produce mercy. It produces mismatches that were scheduled to be mismatches, and depth gaps that show up hardest when the second units are on the field.
The week one sample is 43 team games, which is small, and the direction rather than the size of that number is the part worth carrying.
It does not say to lay big numbers. It says that if you have already decided to lay one, the specific reason people talk themselves out of it is not supported by last season. That is a narrow claim on purpose.
It also does not price anything. A 78.4 percent conditional cover rate is a conditional probability given a state the game may never reach, and it says nothing about what the ticket costs before kickoff. The unconditional question, whether a 24.5 point favourite covers 24.5, is a completely different question and this study does not answer it.
How This Was Built
- Game sample
- Every 2025 FBS regular season game returned by the ESPN college football scoreboard endpoint for season type 2, weeks 1 through 16, group 80, with a completed status and a four quarter line score. 888 games, all 888 carrying full quarter data.
- Team games
- Each game is split into two observations, one per team, so a single game contributes both the leader and the trailer. 1,776 team games.
- Three quarter lead
- The sum of a team's first three quarter scores minus the opponent's, taken from the ESPN line score. Overtime points fall into the final score only, never into the three quarter figure.
- Fourth quarter differential
- Fourth quarter points scored minus fourth quarter points allowed, from the same line score. Overtime is excluded from this figure and included in the final margin, so a game that went to overtime can show a fourth quarter differential of zero and a nonzero final margin.
- Cover thresholds
- 20.5 and 24.5 are used as final margin cutoffs because they are the two numbers on the board today. They are applied as final score margins, not against any actual closing line.
- Week 1
- The 96 games ESPN assigns to week 1 of the 2025 regular season, giving 192 team games and 43 instances of a three touchdown three quarter lead.
What is not checked, and cannot be:
- No betting lines anywhere in this study. Every percentage is a final score margin against a fixed cutoff, not a cover rate against a real closing number, and the two are not the same statistic.
- Everything here is conditional on a game state. Knowing that an 88.7 percent cover rate follows a 21 point third quarter lead tells you nothing about how often a team gets to a 21 point third quarter lead in the first place.
- One season. 282 team games at a 3.2 percent giveback rate has a binomial standard error of about 1.0 point, so the true rate could reasonably sit anywhere from roughly 1 to 5 percent.
- The week one split rests on 43 team games. The +5.70 figure is unstable at that sample size and should be read as a direction, not an estimate.
- No control for whether starters were actually pulled, which is the mechanism the whole garbage time argument rests on. This measures the outcome, not the cause.
- Overtime handling means a small number of games contribute a fourth quarter differential that understates what happened after regulation ended.
- Nothing here says which side of any particular game to take.