Cincinnati Scores Fewer Runs At Home, And The Play Is The Over
This was the board as of the date shown. Any price shown below is the price that was available at that time, not a current quote. The original analysis is unchanged; present-tense wording has been corrected so nothing reads as live.
Two hundred and thirty one runs at home. Two hundred and thirty one runs on the road. The Cincinnati Reds have played 57 games inside Great American Ball Park and 54 games away from it, and the run column has landed on the identical number twice. Per game that makes them a slightly worse offense in their own building, 4.05 against 4.28, in a park most people file under launching pad without ever checking.
Four plays are down on that night's fifteen game board, 7.5 units, and two of them are on the Reds inside that building.
Every play on this page is a home and road split bet. Not a record bet, and not a matchup read in the ordinary sense. In three of the four the split argues directly against the season line sitting next to it, and Cincinnati is the loudest of them, because the number above says the ballpark does nothing for the Reds and the play still says over.
| Game | The Play | Price | Size |
|---|---|---|---|
| Athletics at Reds, 6:40 ET | Cincinnati Reds team total over 4.5 | -115 | 2u |
| Athletics at Reds, 6:40 ET | Cincinnati Reds moneyline | -129 | 1.5u |
| Dodgers at Cubs, 8:05 ET | Los Angeles Dodgers moneyline | -184 | 3u |
| Tigers at Mariners, 9:40 ET | Seattle Mariners moneyline | -118 | 1u |
Those four prices are the numbers actually taken and logged before first pitch. They are not a scrape of anybody's screen and they will not match every board.
Start with the strangest number the Reds own. Cincinnati has hit 145 home runs this season. So have the Los Angeles Dodgers. The Dodgers have scored 577 runs. The Reds have scored 462.
One hundred and fifteen runs separate two clubs with identical home run totals, and the gap is explained by everything that happens between the home runs. Cincinnati is batting .230 with a .708 OPS and has struck out 1,057 times, the highest strikeout total of any team playing on this card. They rank 24th in baseball at 4.16 runs per game. This is a lineup that does not build innings. It clears a team total in one swing or it does not clear it.
The ballpark shows up in exactly that column and nowhere else. Of Cincinnati's 145 home runs, 79 have come in 57 home games and 66 in 54 road games, a jump from 1.22 per game away to 1.39 at home. The runs stay flat. The home runs do not.

Brady Singer takes the ball for Cincinnati at 4.68 with 21 home runs allowed in 107.2 innings, in the park where the Reds have hit 79 of their own.
Across the field, the Athletics have been a different pitching staff away from home all year: a 5.23 ERA on the road against 4.49 at home, a 1.46 road WHIP, and 81 home runs surrendered in road games. J.T. Ginn is the one arm on that staff having a real season, 19 starts, 109.1 innings, a 3.46 ERA and a .211 opponent average. He has also walked 49 men in those 109.1 innings, which is 4.03 per nine. Free baserunners in front of a home run offense is the entire shape of the over.
Oakland's offense at home and Oakland's offense on the road are barely the same team. At home the Athletics have scored 285 runs in 57 games, 5.00 per game, hitting .264 with a .790 OPS. On the road they have scored 202 in 55, which is 3.67 per game, hitting .225 with a .650 OPS.
That is a drop of 1.33 runs per game and 140 points of OPS, and it is the reason a 53-58 club is laid at minus 129 against a 45-67 club without the number feeling short. The Athletics arrive on a five game losing streak, 2-8 across their last ten, carrying a minus 154 run differential. Nobody else on that night's fifteen game slate is within 90 runs of that mark.
The honest problem with the play is on the mound and in the home dugout. Cincinnati is 26-31 at Great American, a worse record at home than the 27-27 it has posted on the road, and its own staff has issued 249 walks in 57 home games with a 4.29 home ERA. Brady Singer answers Ginn with a 4.68 ERA, a 1.43 WHIP, a .273 opponent average and 21 home runs allowed in 107.2 innings. The park that is being counted on to lift the Reds team total is the same park where Singer has to make 90 pitches.
Three units, the largest position on this page, and the split behind it is stark. Los Angeles is 36-21 away from Dodger Stadium and 33-23 inside it. On the road the Dodgers have scored 329 runs in 57 games, 5.77 per game, hitting .273 with an .800 OPS. At home they have scored 248 in 56, which is 4.43 per game, hitting .251 with a .740 OPS. One team, 1.34 runs of difference, and the better half of it is the half that gets on the plane.
Wrigley Field, meanwhile, is not doing for Chicago what the record implies. The Cubs have scored 5.11 runs per game at home and 5.16 on the road. Their home record is 32-24 and their road record is 32-25. There is no meaningful Wrigley effect in either column.
Then there is the arm. Tarik Skubal has walked 14 batters in 96.2 innings, which is 1.30 per nine, against 116 strikeouts and a .210 opponent average. He is running better than eight strikeouts for every walk he issues. Javier Assad answers with a 3.75 ERA that reads fine until the home run column, where 12 in 69.2 innings works out to 1.55 per nine, and he is striking out 6.20 per nine against a Dodgers lineup hitting .273 on the road.
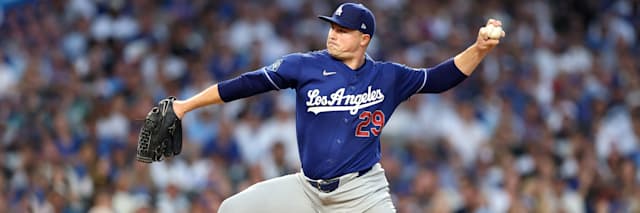
Tarik Skubal: 14 walks in 96.2 innings, 116 strikeouts, .210 opponent average. The price at minus 184 is paying for the control, not for the logo.
Here is what is wrong with laying minus 184. The Cubs are 64-49 with the second best offense in baseball at 5.13 runs per game, and they are at home. Los Angeles has lost four straight and is 4-6 across its last ten. There is no discount being stolen here and no soft number to point at. The play is a bet that Skubal's walk rate travels and that Assad's home run rate does too, priced at a number that already assumes most of that.
The Mariners are 55-58. They are also 32-24 at home and 23-34 on the road, which is a 63 point winning percentage swing for the same 26 men.
What is unusual is where the swing comes from. Seattle's offense is nearly identical in both places, 4.04 runs per game at home and 4.00 on the road, and it is the 28th ranked offense in baseball either way. The pitching is where the building matters. At T-Mobile Park the Mariners own a 3.21 ERA and a 1.07 WHIP and have allowed 193 runs in 56 games, which is 3.45 per game. On the road that becomes a 4.32 ERA, a 1.31 WHIP and 4.53 runs allowed per game.
Score four and give up three and a half. That is not an offense winning games. It is a pitching staff turning a bad lineup into a 32-24 home record, and Emerson Hancock fits the profile: a 3.26 ERA and a 1.04 WHIP across 20 starts, 27 walks in 110.1 innings, a .217 opponent average.
The counterpoint is sitting in the visiting clubhouse and it is a good one. Troy Melton has a 1.75 ERA, a 0.93 WHIP and a .174 opponent average across 11 starts and 67 innings, the best line of any starter on that night's board. Detroit has won three in a row, is 6-4 in its last ten, and carries a plus 63 run differential against Seattle's plus 3. Minus 118 on the 55-58 club is an honest price and there is no argument that it is a mistake.
Three and a half of the 7.5 units on this page are in one game in Cincinnati, and the two positions are correlated rather than independent. A Reds lineup that puts five on the board against Ginn is very likely a Reds team that won the game, which means the moneyline and the team total will usually settle the same direction. That is a concentration risk being taken on purpose, and it is worth naming instead of pretending the two tickets diversify anything.
The team total itself asks a 24th ranked offense hitting .230 to clear 4.5 against a starter holding hitters to .211. Ginn's walk rate and Great American's home run rate are the whole case. If he throws strikes for six innings, the number does not get close.
One more caveat belongs on every figure above. Home and road splits at 111 to 113 games are half season samples and they regress. A Dodgers club scoring 5.77 on the road and 4.43 at home is far more likely to be a 5.1 run offense that got its hits in a lopsided order than a team with a genuine road talent. Splits describe what already happened. They do not schedule what happens that night, and none of them survive a bad first inning.
So the card stands where the opening number left it. Cincinnati does not score more runs at home, and 2 units are on Cincinnati scoring five. Seattle cannot hit and 1 unit is on Seattle winning. Los Angeles is being laid at a price the market has already sharpened, on the strength of a road split that half of baseball would call noise. Every one of those objections is real and none of them moved the plays. Check the number in front of you before it becomes a different bet than the one written here.
Related reading: MLB betting guide: totals, pitching and park factors
Monday's board: the public took the under in all eight games
Post-All-Star-break scoring trends · Latest analysis · Full archive
Sources and checking
- All fifteen matchups, team records, probable starters, venues and first-pitch times
- MLB Stats API schedule feed for August 4, 2026, pulled that day
- Every starting pitcher line (ERA, WHIP, innings, starts, walks, strikeouts, home runs, opponent average)
- MLB Stats API 2026 season pitching stats by player, pulled that day
- Team runs, runs per game, batting average, OPS, home runs and strikeouts, plus the league-wide scoring ranks
- MLB Stats API 2026 team hitting leaderboard for all 30 clubs, pulled that day and ranked in full
- Every home and road split on this page (runs, average, OPS, home runs, ERA, WHIP, runs allowed)
- MLB Stats API 2026 team statSplits feeds, home and away situation codes, pulled that day per club
- Home records, road records, run differentials, last-ten form and active streaks
- MLB Stats API standings feed dated August 4, 2026, pulled that day
- Player photos (Singer, Skubal)
- MLB.com official photo CDN, player IDs taken from the same schedule feed and both images confirmed returning HTTP 200 that day
- The four plays, their prices and their unit sizes
- Supplied by the handicapper and logged before first pitch. The prices shown are the numbers actually taken, not a book screen scrape
This piece is a pregame split read that carries a four play card. Every record, rate and split above was pulled from a live feed that day rather than written from memory, and each one was reconciled against a second pull before it went on the page.
What is not checked, and cannot be:
- The four prices on the card are the numbers taken at one book. They are not a consensus, they will not match every screen, and the unit sizes are the handicapper's own staking rather than a recommendation scaled to anyone else's bankroll.
- No ticket or money percentage split was pulled for any of that night's games. Nothing on this page is a claim about where public or sharp handle is sitting.
- Home and road splits are half season samples of roughly 55 games a side. They are descriptive, they regress, and they are not park factors computed against league baselines.
- Bullpen usage over the past three days was not pulled for any club. The relief workload behind every starter above is unknown as of writing.
- The Athletics home and road game counts differ by one between the hitting and pitching split feeds, so every pitching figure for that club is quoted as a rate or a season total rather than a per-game average.
- Batting orders had not been posted when this was written. Late scratches, weather and any lineup news published afterward postdates the page.