The Dodgers-Yankees Under 9 That Has To Survive Roki Sasaki
This was the board as of the date shown. Any price shown below is the price that was available at that time, not a current quote. The original analysis is unchanged; present-tense wording has been corrected so nothing reads as live.
Nineteen home runs. That is what Roki Sasaki has surrendered in 81 innings this season, a rate of 2.11 per nine, and that night he walks into Yankee Stadium with a 5.33 ERA and a 1.36 WHIP to open the second half. Everything about that sentence says over. The card says under 9 at plus 100, a unit and a half. This is the read, and it is the one worth arguing about, because it only works if you are willing to bet the four things around Sasaki instead of the man himself.
Four days of nothing just ended. Nobody played from Monday through Thursday, the All-Star break swallowed the middle of July, and that night everybody comes back cold at once. Five reads on this board, 8 units total, and that is the whole card. No props. No stacking a first-half hot streak that has been sitting in a hotel lobby since Sunday.
Dodgers-Yankees Game Total Under 9 (+100, 1.5 Units) At Yankee Stadium
Start where the money actually is. The Dodgers allow 3.68 runs per game. The Yankees allow 3.86. Those are the two lowest numbers among the four clubs playing in that night's two featured games, and they belong to the two teams standing in the same building at 7:05. Los Angeles has given up 357 runs in 97 games on the way to a 61-36 record and a plus 149 differential. New York has given up 371 in 96 while going 54-42. Neither of these teams wins by outslugging people anymore. Both of them win by taking the bat out of your hands.
Run the crude arithmetic and it lands where the ticket does. The Dodgers score 5.22 per game and the Yankees allow 3.86, which splits to 4.54. The Yankees score 4.81 and the Dodgers allow 3.68, which splits to 4.25. Add them and you get 8.79 expected runs against a posted number of 9. That is not a screaming edge. It is a number below the line, at plus money, in a game where the total is priced at a full nine because of the logos and the ballpark rather than the run prevention.
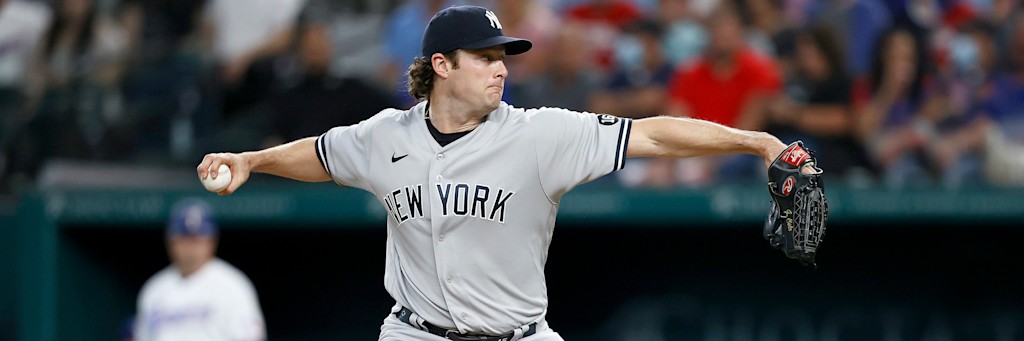
Gerrit Cole is the half of this matchup nobody is talking about, and he is the reason the under has a floor. A 4.04 ERA does not look like an ace line until you read underneath it: a 1.20 WHIP, 47 strikeouts against 11 walks in 49 innings, a strikeout-to-walk ratio of 4.27, and a.249 opponent average. Eleven walks. He is not putting free runners on against a Dodgers lineup that punishes exactly that. Cole has made only nine starts in a 96-game season, and we are not going to pretend we know why, because we did not verify it. What we can verify is the quality of the innings he has thrown, and they have been clean.
Now the part that argues against us, said plainly. Sasaki's profile is an over profile. A 2.11 home run per nine rate in Yankee Stadium is the single scariest input on this card, and the short porch does not care that Los Angeles is 30-17 on the road. Our own model projects this game at roughly 9.27 combined runs, which is above the number we are betting. We are not going to dress that up. That model's offensive rollups have not seen a live game since Sunday because there were no games to see, so it is stale by four days on exactly the inputs that matter, and we are not treating a stale projection as a reason to pass on a plus-money price. But it disagrees with us, and you deserve to know that before you decide.
Here is what tips it. The Dodgers have lost three straight and just spent four days off, so whatever was wrong with the bats at the break has had no chance to be fixed against live pitching. Timing is the first thing to go and the last thing to come back. Plus 100 on a nine, with two run-prevention machines and a Cole command line on one side, is a price that pays even money on the likelier half of a coin flip. A unit and a half.
| Club | Record | R/G Scored | R/G Allowed | Starter | ERA | WHIP | K/BB |
|---|---|---|---|---|---|---|---|
| Dodgers (at NYY, 30-17 road) | 61-36 | 5.22 | 3.68 | Roki Sasaki | 5.33 | 1.36 | 80/33 |
| Yankees (home) | 54-42 | 4.81 | 3.86 | Gerrit Cole | 4.04 | 1.20 | 47/11 |
Cleveland Guardians Moneyline (-122, 1 Unit) Against The Pirates At Progressive Field
The second read is smaller, simpler, and it is a bet on one arm and one workload gap.
Gavin Williams has been the best pitcher nobody outside Ohio discusses. He is 10-4 with a 3.81 ERA across 19 starts and 113.1 innings, and the strikeout column is the story: 134 punchouts, a 10.64 K/9, a.222 opponent average, and a 1.15 WHIP. That is a genuine frontline half, made through a full nineteen-start workload, and he takes the ball at home for a Cleveland club that has won four in a row.
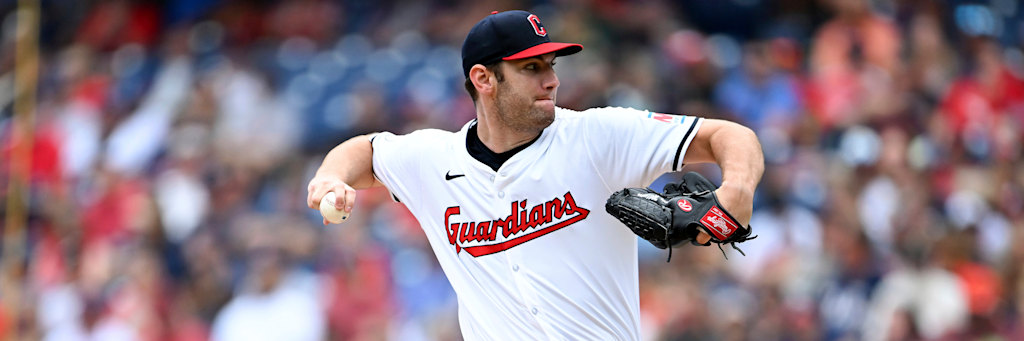
Jared Jones is the other side, and this is not a hit piece on him. His rate stats are good. He is 1-1 with a 4.37 ERA, a 1.14 WHIP, a 10.03 K/9, and a.220 opponent average, and on a per-inning basis he is roughly Williams's equal. The difference is the denominator. Jones has thrown 35 innings all year across eight starts. Williams has thrown 113.1 across nineteen. When one starter has thirty-five innings in his legs and the other has a hundred and thirteen, on the first night back from four days of rest, the club with the length advantage is the club that gets to keep its bullpen in order for the sixth and seventh. We are not going to speculate about why Jones's season is only eight starts long, because we did not verify a reason. The innings themselves are the fact, and the innings are what we are betting.
The honest counterpoint is loud here, louder than in the Bronx. Pittsburgh is the better offense by a distance: 5.32 runs per game against Cleveland's 3.97, and the Pirates are 7-3 over their last ten with a plus 44 differential. The Guardians are 51-46 with a minus 2 run differential, which means their record is running ahead of their run math, and their 24-22 home mark is nothing to lay a price on. Run the same crude arithmetic that supported the under and it does not support this side: Pittsburgh's bats against Cleveland's run prevention split to 4.66, Cleveland's bats against Pittsburgh's split to 4.42. The averages like the Pirates.
So why the Guardians at minus 122. Because season-long run averages are the wrong tool for a one-night pitching mismatch, and the mismatch is not in the rate stats, it is in the tank. The Pirates score 5.32 per game against the general population of starters. that night they see a 10.64 K/9 with a.222 opponent average who can go deep enough to hand the game to a rested Cleveland bullpen. One unit. Not more, because the offense behind Williams is the weakest of the four in this piece and we know it.
| Club | Record | L10 | R/G Scored | Starter | ERA | Season IP | K/9 |
|---|---|---|---|---|---|---|---|
| Pirates (at CLE) | 50-47 | 7-3 | 5.32 | Jared Jones | 4.37 | 35.0 | 10.03 |
| Guardians (home, 24-22) | 51-46 | 6-4 | 3.97 | Gavin Williams | 3.81 | 113.1 | 10.64 |
Reds-Rockies Game Total Over 12 (-110, 1.5 Units) At Coors Field
The card has an over on it, and it is the one game on the board where an over on 12 is a defensible number instead of a fantasy. Cincinnati at Colorado plays at Coors Field, the thinnest air in the sport, where fly balls carry, breaking pitches flatten out, and a posted total in the double digits is a starting point rather than a ceiling. The Rockies are 39-59 and they have earned every bit of that record by giving up 555 runs in 98 games, a shade under 5.7 a night, the leakiest run prevention among the six clubs in this piece. When the home team bleeds that many runs and the venue is the one it is, the honest question is not whether 12 is high. It is whether either pitcher can stop it.
Brady Singer is the visiting arm and his line reads like a Coors accelerant before he ever gets on the plane. He is 3-9 with a 4.72 ERA across 18 starts and 89.2 innings, a 1.47 WHIP, and a.280 opponent average, and he has already surrendered 20 home runs at sea level this season. Take a contact profile that ordinary into altitude and the margin for a quiet night shrinks fast. On the other side is Gabriel Hughes, and this is where we stay honest: Hughes has thrown nine innings in the majors, one start, a 3.00 ERA off a sample too small to lean on in either direction. A rookie arm with almost no big-league track record, working the highest-scoring park in baseball, is a coin we are happy to see flipped when the number is an over.
Now the argument against, plainly. Neither of these offenses is a wrecking crew on paper. The Reds score 4.16 a game and hit.230 as a team, and the Rockies put up 4.76, so blend the season rates and you land near nine combined runs, not thirteen. This is not a bet on two great lineups. It is a bet on the ballpark and on two starters who allow contact, one of them proven hittable and the other barely tested. A unit and a half says the altitude and the arms carry it past 12.
| Club | Record | R/G | Starter | ERA | IP | WHIP | BAA |
|---|---|---|---|---|---|---|---|
| Reds (at COL) | 43-52 | 4.16 | Brady Singer | 4.72 | 89.2 | 1.47 | .280 |
| Rockies (home, Coors) | 39-59 | 4.76 | Gabriel Hughes | 3.00 | 9.0 | 1.00 | .188 |
Baltimore Orioles Team Total Under 4.5 (-133, 1 Unit) At Houston
The Orioles are the hot team on this card, and that is exactly why the number is worth fading. Baltimore comes in 46-51 but 7-3 over its last ten, riding a wave of run-scoring that has pushed the season rate to 4.61 a game. The team total is set at 4.5, right on top of that average, and the reason a one-unit under is live anyway sits on the mound for Houston. Peter Lambert has been quietly excellent: 8-5 with a 3.14 ERA over 15 starts and 86 innings, a 1.12 WHIP, and a.201 opponent average that ranks with the best contact suppression the Orioles will see this month.
The split sharpens it. Baltimore hits.239 as a club, and away from home the record is 18-26, a road profile that has not matched the recent surge. A.239 offense that struggles on the road, staring at a starter holding the league to a.201 average, is a lineup being asked to clear a bar its season number barely reaches. Under 4.5 means four Baltimore runs or fewer, and Lambert is the kind of arm who turns a hot offense back into an average one for a night. One unit, because the O's bats are genuinely warm and that risk is real, not something we are pretending away.
| Team | Record | R/G | Team AVG | Road | Opposing Starter | ERA | Opp BAA |
|---|---|---|---|---|---|---|---|
| Baltimore Orioles | 46-51 | 4.61 | .239 | 18-26 | Peter Lambert (HOU) | 3.14 | .201 |
Texas Rangers Team Total Under 3.5 (-140, 3 Units) Against Chris Sale In Atlanta
This is the biggest play on the card, three units, and it is the simplest one to explain. Chris Sale is starting for Atlanta, and the line he carries into this game is the best pitching on the entire slate: 9-6, a 2.20 ERA over 17 starts and 98 innings, a 1.11 WHIP, 117 strikeouts against 25 walks, and a 10.74 K/9. When an ace running a strikeout rate north of ten faces a modest offense in his own park, the team total under is the cleanest expression of that gap, and Texas at under 3.5 is exactly that bet.
The Rangers are not the lineup to break Sale open. Texas scores 4.16 runs a game, the same bottom-tier rate as the Reds, hits.245 as a club with a.719 OPS, and sits at 25-25 on the road. Ask that group to put up four runs against a strikeout machine in Atlanta and the math leans hard toward the under. Three or fewer Texas runs is the requirement, and against a 2.20 ERA arm mowing down a.245 offense, that is the likelier outcome by a distance that justifies the size.
The honest counterpoint is the price and the number. Minus 140 is real juice, and 3.5 is a low bar that a single three-run inning erases, so this is not a free three units. Sale's.230 opponent average is not microscopic, and any lineup can string two hits and a mistake together. But the volume of strikeouts against a below-average offense is the edge, and it is the one spot on this board where the conviction is high enough to lay the number and the price together. Three units.
| Team | Record | R/G | Team AVG | Road | Opposing Starter | ERA | K/9 |
|---|---|---|---|---|---|---|---|
| Texas Rangers | 49-47 | 4.16 | .245 | 25-25 | Chris Sale (ATL) | 2.20 | 10.74 |
That is the whole second-half opener. A unit and a half on a Dodgers-Yankees under 9 at plus 100, backing the two stingiest run-prevention units in that night's featured pair and an eleven-walk Cole command line, with eyes open about the 5.33 ERA and the 19 home runs standing on the other mound. One unit on a Cleveland moneyline at minus 122, backing a 134-strikeout half and a 78-inning workload edge, with eyes open about a Pittsburgh offense that is better than Cleveland's by a run and a third per game. A unit and a half on Reds-Rockies over 12 at Coors, a bet on the altitude and two arms that give up contact rather than on either lineup's base rate. One unit on the Orioles team total under 4.5, laying that a road offense hitting.239 stays quiet against Peter Lambert and his.201 opponent average. Three units, the biggest of the night, on the Rangers team total under 3.5, backing a Chris Sale line of a 2.20 ERA and a 10.74 K/9 against a Texas lineup that scores 4.16 a game. Five reads, 8 units, all of them arguable, none of them dressed up. The market sets the price. The card reads the matchup.
More from Sports Betting Prime
Betting guides — how lines are made, why they move, and how to price a bet.
Free calculators — odds conversion, implied probability, vig removal, expected value, parlays and Kelly staking.
MLB betting fundamentals — totals, pitching and park factors.
Betting glossary — every term, defined plainly.
All analysis — every dated piece, newest first.
Find verified handicappers on Trust My Record — records timestamped before the game and graded automatically.
Sources and checking
- Data source
- MLB Stats API (statsapi.mlb.com) — schedule, standings and season pitching lines
- Statistics as of
- 16 July 2026
Statistics on this page were taken from the MLB Stats API when the article was written. They have not been independently re-checked since, and no fact manifest exists for this article. Treat the figures as accurate to the date below and no further.
What is not checked, and cannot be:
- Odds and prices. These come from the author's own betting card. No sportsbook feed is queried and no archived quote is kept, so no price on this page can be substantiated after the fact.
- Stake sizes and unit counts. Editorial judgement, not a measurement.
- Any characterisation of market behaviour or where money is going. Not sourced.